Figure 1.
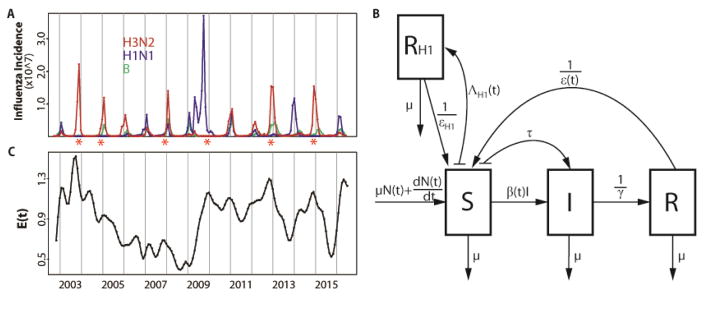
Data and model. (A) Monthly influenza incidence data for the US between October 2002 and June 2016. Red, blue and green curves are for subtype H3N2, subtype H1N1 and type B respectively. Seasons with an antigenic cluster transition were marked with asterisks. (B) Diagram for the epidemiological model. A classical susceptible-infected-recovered-susceptible (SIRS) epidemic model was used to represent the population dynamics of H3N2 incidence. The SIRS model is a compartmental formulation that follows the number of individuals into three classes, for susceptible (S), infected (I) and recovered (R) individuals respectively. People die at a constant rate μ. N(t) is the population size and the birth of individuals was specified as to capture the observed increase of the population. Susceptible individuals in S move to the I class after contact with an infective and transmission of the disease at rate β(t). This transmission rate includes a seasonal component, a dependency on the antigenic change of the virus, and environmental noise. Infected individuals eventually recover with an average infectious period of γ and move to the R class where they are protected by acquired immunity. Specific immunity is temporary and will be lost after an average latent period ε(t), with individuals in R returning to the S class. Parameter τ is the rate of external importation of H3N2 cases. An additional RH1 class was designed to track the protected population due to infection by H1N1. The rate of transition to the RH1 class is given by ΛH1(t), which depends on the observed incidence of H1N1 scaled to take into account the estimated reporting error. Individuals in the RH1 return back to the R class after an average latent period of εH1. (C) Monthly evolutionary change E(t). The transmission rate β(t) in our first model incorporating evolutionary change depends on this evolutionary index. E(t)was calculated based on epitope sites of HA, as a weighted sum of normalized amino acid distances (hamming distances) between strains in month t and previous strains. Those distances were weighted by a decaying function back in time whose time scale was estimated as part of the model fitting. Details are described in the Evolutionary Index section of the Materials and Methods.

