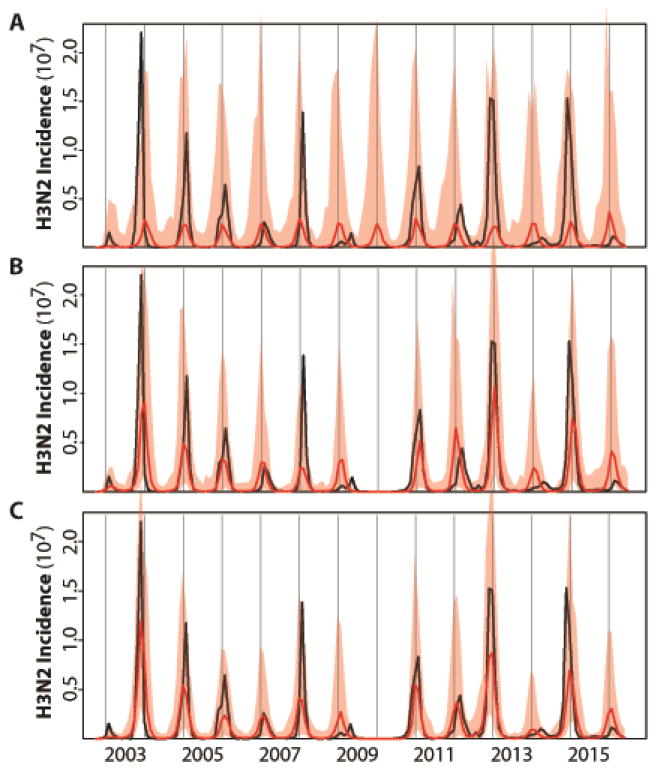
Figure 2.
Illustration of the best model fits for the (A) basic, (B) continuous and (C) cluster models. See Table 1 for the specification and statistical comparison of the different models considered. Here, monthly simulations of the respective models with the MLE (Maximum Likelihood Estimates) parameters are shown for the median (in red) and 2.5–97.5% quantiles (shaded red) of 1000 simulations starting from estimated initial conditions in October 2002. For comparison, the observed monthly H3N2 incidence data for the US are shown in black. The basic model which incorporates only a fixed seasonality and no information on H1N1 in (A) fails to capture the temporal variability in the size of seasonal outbreaks; whereas the two models that include a dependence on the levels of H1N1 and on the evolutionary change of the virus (in a continuous fashion in B, and a discrete one in C) do represent this interannual variation.

