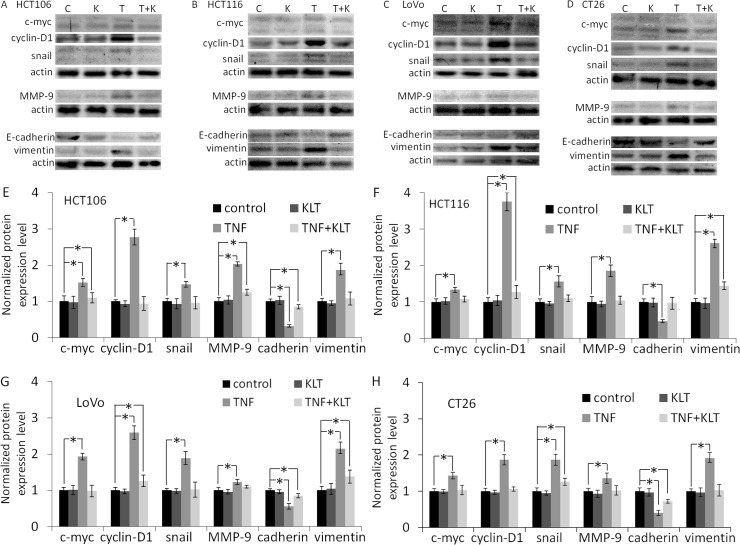
Figure 2. Western blot analysis of c-myc, cyclin-D1, snail, MMP-9, E-cadherin and vimentin expression.
Experiments were performed in triplicate. (A–D) Protein expression in the four CRC cell lines after treatment with different reagents, as indicated. C represents control, K represents KLT only, T represents TNF-α only, and T+K represents TNF-α plus KLT. (E–H) Bar diagrams of densitometric analysis of data in panels A–D. *P < 0.05 indicates a significant difference compared to the control group. Full length blots of A–D are shown in Supplementary Figure 6.

