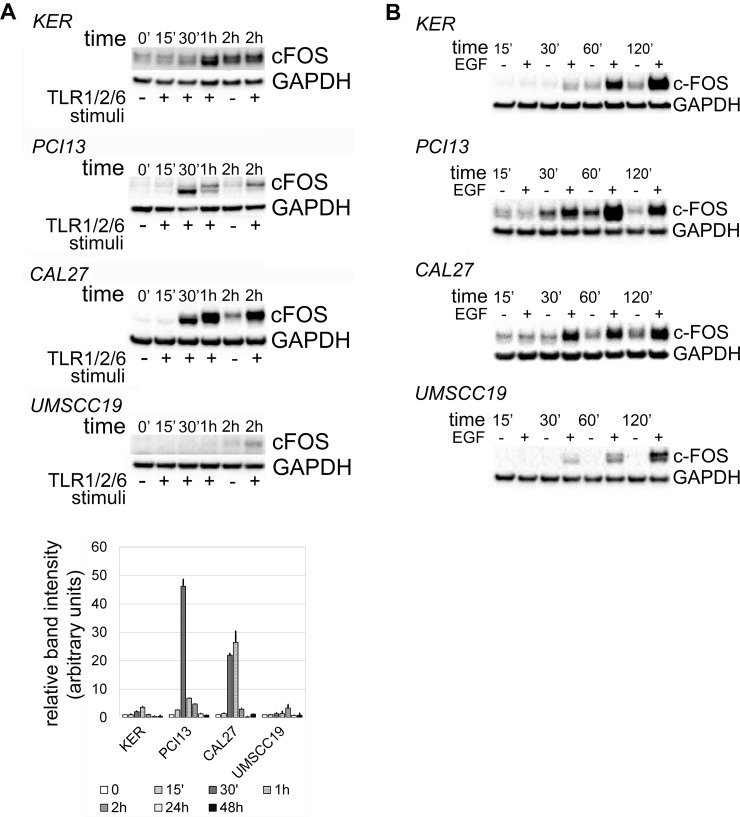
Figure 3.
Kinetics of c-FOS accumulation in response to TLR2 stimuli (A) and EGF (B). OSCC cells Cal27, PCI13 and UMSCC19 and keratinocytes hTERT HAK Clone 41 were incubated with Pam3CSK4 and FSL-1 or with EGF for up to 48 hrs. Protein was collected at indicated time points and analyzed as described in Materials and Methods. Briefly, samples were separated by SDS-PAGE electrophoresis, transferred to nitrocellulose membrane, and probed for c-FOS and GAPDH. Mean relative densitometry values from two independent experiments, normalized to controls, are represented in the lower panel. Error bars = standard error.

