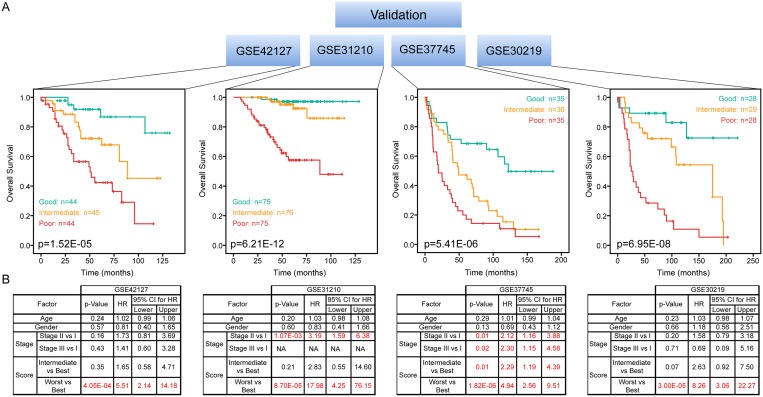
Figure 6. Independent validation of 27-gene signature.
Kaplan-Meier overall survival curves were generated for four independent LuADC patient cohorts according to the prognostic score using the 27-gene signature. The patient cohort was divided into tertiles based on the prognostic score and the log-rank p-value of the curve comparison between the groups is shown. The hazard ratio and the 95% confidence interval was calculated using a Cox model based on tumor stage (I–IV), gender, age at diagnosis and prognostic score as covariates. Significant factors are highlighted in red.

