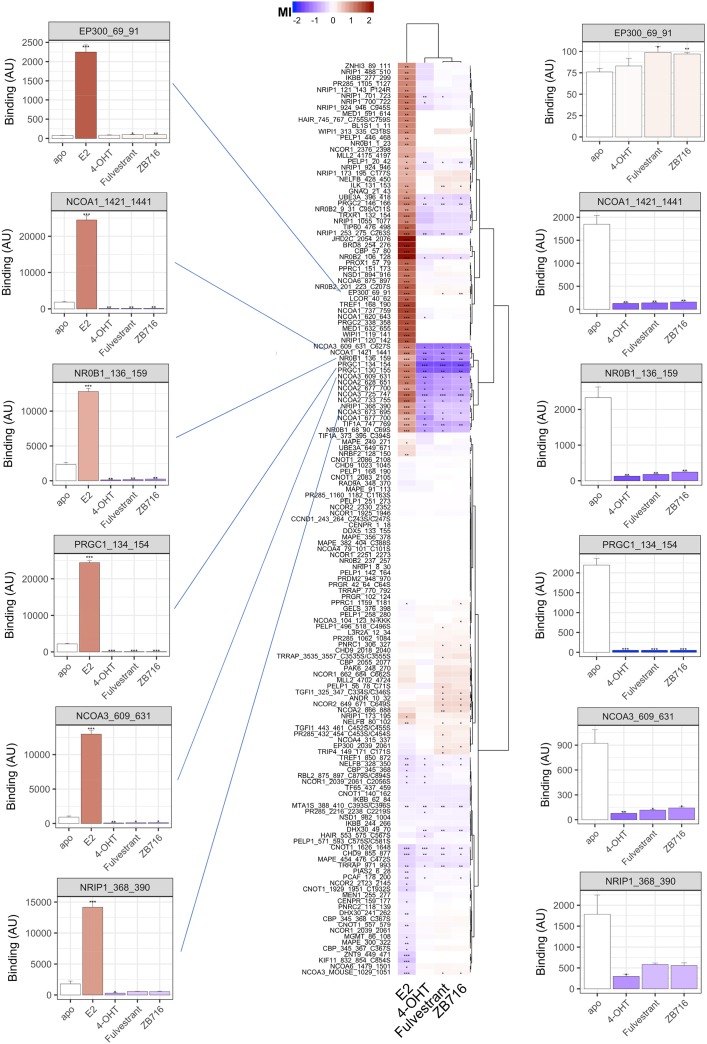
Figure 3. Modulation of ERα-coregulator interaction by 17-β-Estradiol (E2), 4-hydroxy-tamoxifen (4-OHT), fulvestrant, and ZB716.
Compound effects are indicated by the modulation index (MI), i.e. compound-induced log-fold change of ERα-LBD interaction with peptides representing individual coregulator-derived binding motifs. Enhancement of binding are indicated in red while peptide displacement is indicated in blue. Compound and interaction (dis)similarities are visualized by Hierarchical clustering (Euclidean distance, Ward’s). Bar graphs display ER binding (mean +/− S.E.M., Arbitrary Units fluorescence) in the absence (apo) or presence of compound. The bar color represents the MI. Significance of the modulation is indicated (*p<0.05; **p<0.01; ***p<0.001, Student's t-Test vs. apo).

