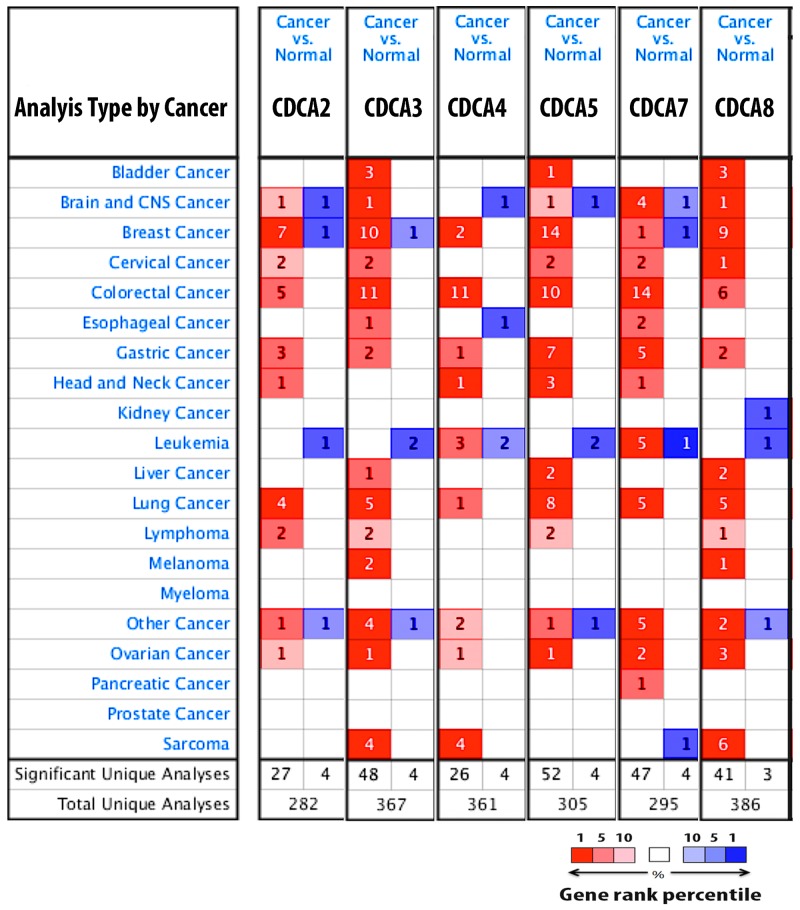
Figure 1. CDCA genes expression in 20 different types of cancer disease.
Data compared mRNA expression of gene in cancer tissue relative to normal matched type tissue. Over and under expression of CDCA genes were displayed with color based manner. Red color represents for over expression of gene while blue color is for under expression of gene. Color transparency slightly shifted top 1% to top 10% in bother over and under expression of gene. The number in each square denoted number of analyse(s) satisfy the threshold such as gene rank percentile (10%), p-value (10E-4), and fold change (1.5).

