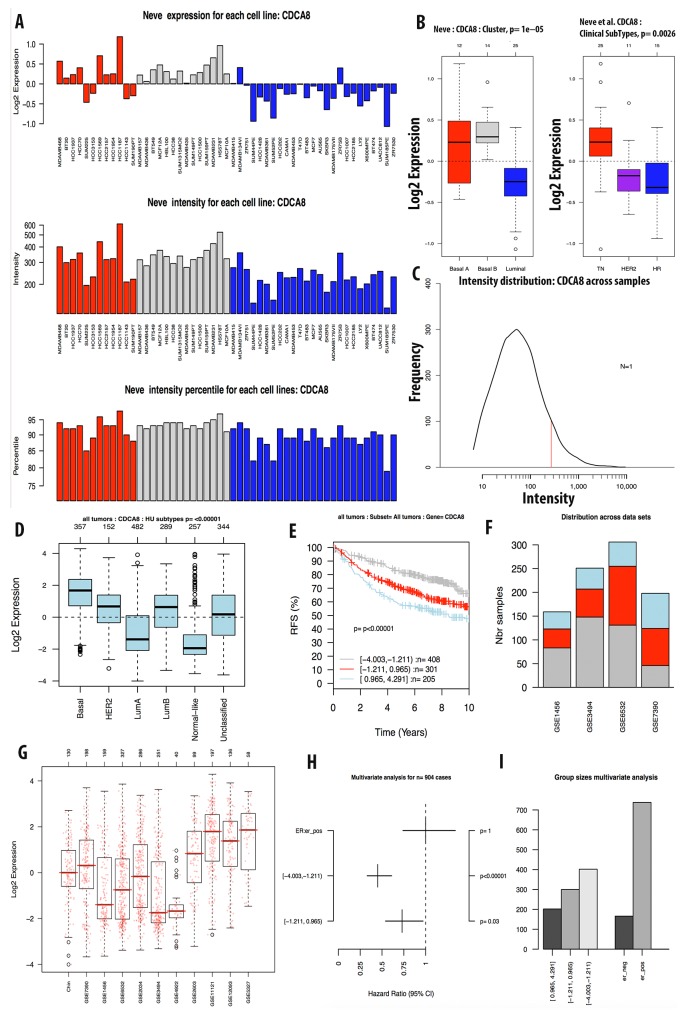
Figure 6. Analysis of CDCA8 expression in breast cancer tumor and cell line by GOBO database.
Expression of CDCA8 in six subtypes of breast cancer tumors (A). RFS analysis of CDCA8 expression in tumor of patient survival with high expression in light blue, intermediate expression in red, and low expression in grey color (B). CDCA8 expression across datasets (C, D). Forest plot and bar chart of multivariate analysis on the expression of CDCA3 was displayed in (E, F). Expression of CDCA8 in breast cancer cell line using Neve et.al dataset was display in (G-I).

