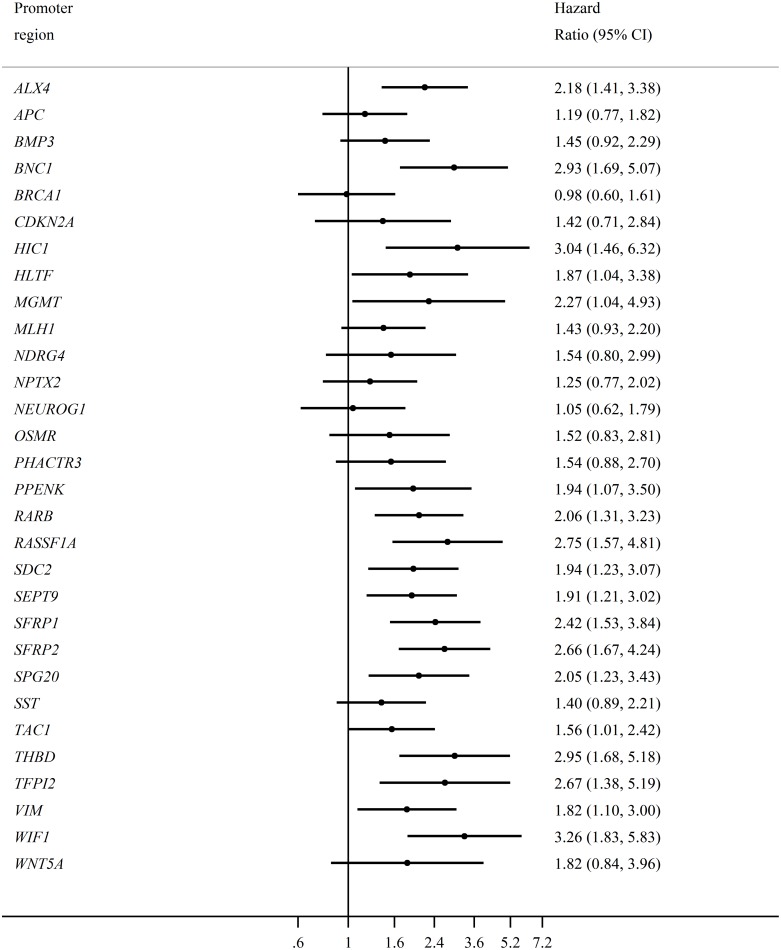
Figure 3. The individual effect of each promoter hypermethylation on overall survival.
Forrest plot visualizing the hazard ratios for all stage CRC patients (N=193). The name of each individual hypermethylated promoter regions is presented on the left, with the corresponding hazard ratio on the right. The bottom horizontal line shows the hazard ratios from 0.6 to 7.2, with the vertical solid line representing the reference line (hazard ratio = 1).

