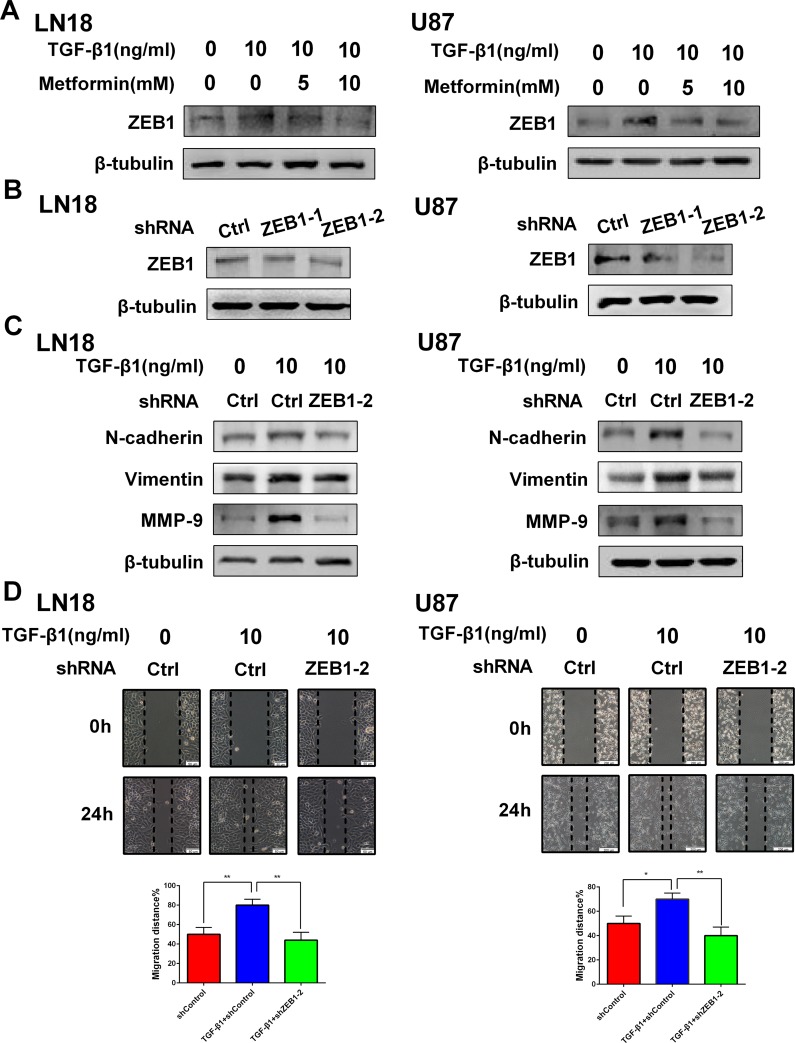
Figure 6. ZEB1 is associated with the inhibitory effect of metformin on TGF-β1 induced EMT-like process in GBM cells.
(A) Western blot results of the inhibitory effect of metformin on TGF-β1- induced ZEB1 expression in LN18 and U87 cells. (B) Western blot results of the effect of ZEB1 knockdown with two different shRNAs (shZEB1-1 and shZEB1-2) and control shRNA (shCtrl) on expression of ZEB1 in LN18 and U87 cells. (C) Western blot results of the effect of ZEB1 knockdown on expression of N-cadherin, Vimentin and MMP-9 induced by TGF-β1. (D) Representative wound-healing images show migratory capacity in LN18 (×100 magnification) and U87 (×40 magnification) cells following exposure to TGF-β1 (10 ng/ml) with or without ZEB1 knockdown. Quantification histograms show the mean level of migration distance observed in three random fields for each condition. *P < 0.05, **P < 0.01 TGF-β1+shCtrl group vs. shCtrl group; TGF-β1+shCtrl group vs. TGF-β1+shZEB1-2 group.

