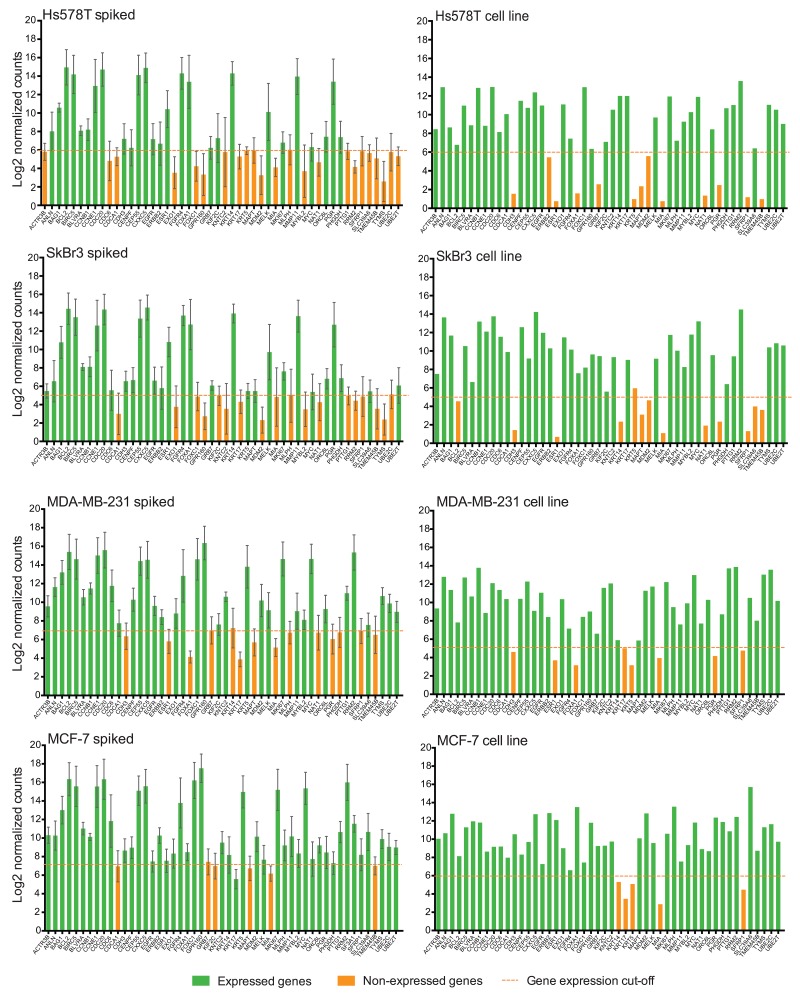
Figure 5. NanoString PAM50 may not distinguish CTC gene signature.
Bar plots show the average of the Log2 gene expression of 50 endogenous genes for all spiked samples (n=6 for each cell line), and for cell line controls. Error bars represent the SEM, and horizontal dotted line corresponds to the gene expression threshold or cut-off background level. NAT gene is not plotted in spiked samples due to absence of MTE primers.

