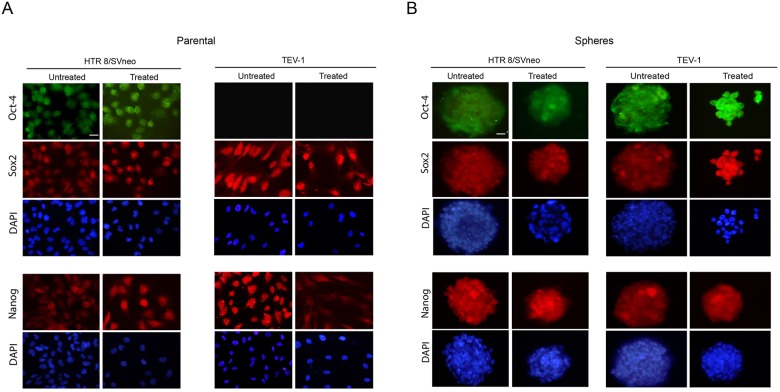
Figure 2. Expression of NANOG, OCT-4 and SOX2 in transformed trophoblast spheroids and parental cells.
(A) (B) Immunofluorescence micrographs of OCT-4, SOX2 and NANOG with DAPI staining in HTR8/Svneo and TEV-1 transformed parental trophoblast cell lines. (B) Immunofluorescence micrographs OCT-4, SOX2 and NANOG with DAPI staining in transformed trophoblast spheroids. Objective magnification 40X. Scale bar = 50μm.

