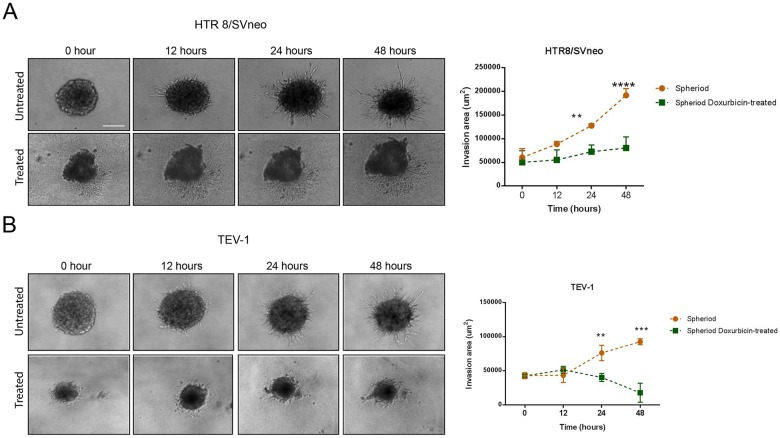
Figure 5. 3-D Invasion of untreated and doxorubicin-treated spheroids.
(A) (B) Invasion pattern of untreated and treated HTR8/Svneo and TEV-1 spheroids and corresponding quantitative analysis of invasion areas. A two-way ANOVA followed by Sidak's for multiple comparisons was carried out. Data represent the mean ±SD of three individual experiments, each performed in quintuplicate (****p<0.0001; ***p<0.001; **p<0.01). Objective magnification=10X.

