
Figure 2.
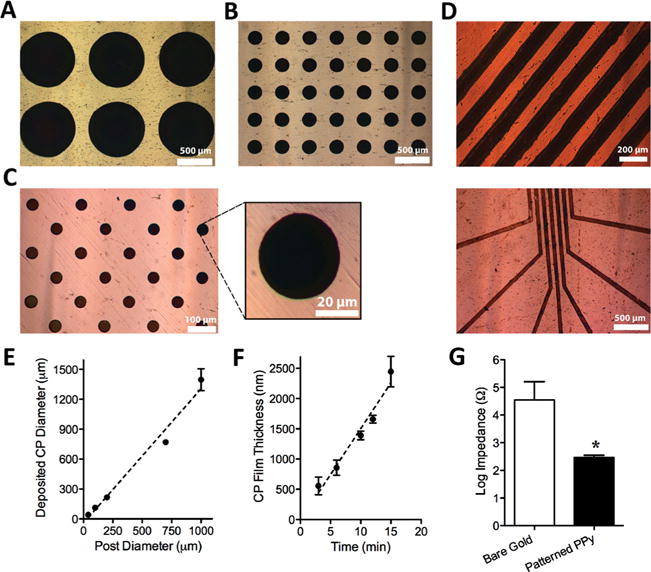
Characterization of patterned PPy films generated by hydrogel-mediated electrodeposition. The top panel shows optical images of the PPy films deposited either from a stamp with circular posts of (A) 700 μm, (B) 200 μm, and (C) 40 μm diameters (and a magnified PPy spot), or from a stamp with (D) linear posts of 100 μm width with two different configurations. (E) The change in the size of deposited PPy film spots as a function of the hydrogel post diameter (circular features). Error bars represent standard error of the mean (N ≥ 60), and the dashed line represents the best linear fit to the data (R2 = 0.9797). (F) The thickness of the deposited PPy film as a function of the electrodeposition time. Error bars in this graph represent standard error of the mean, and the dashed line shows the best linear fit to the data (R 2 = 0.9668). (G) Comparison of the impedance (log values) of the bare electrode and PPy patterned electrode. The error bars show standard error of the mean (P < 0.05, N = 3).