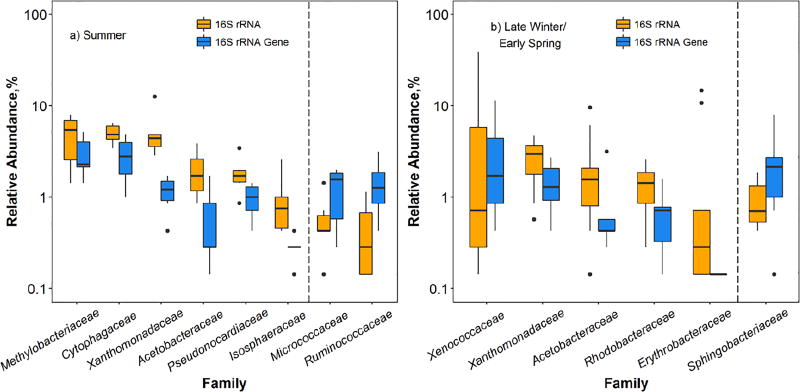
Figure 4.
Bacterial genera that exhibited different relative abundances (p<0.05) in 16S rRNA and 16S rRNA gene sequences of outdoor bioaerosols collected in two seasons. Each boxplot represents the results of six samples collected in a) summer and ten samples collected in b) late winter/early spring. To the left of the dashed line: bacteria genera showing higher relative abundance in 16S rRNA sequences than in 16S rRNA gene sequences; to the right of the dashed line: bacteria genera exhibiting lower relative abundance in 16S rRNA sequences than in 16S rRNA gene sequences. In each boxplot, the line through the middle represents the median. The bottom and top of each box are the 25th and 75th percentiles. Outliers are indicated with points beyond the whiskers and are defined as the data points lower (or higher) than 1.5 interquartile (the difference between the upper and lower quartiles) range of the lower (or higher) quartile.

