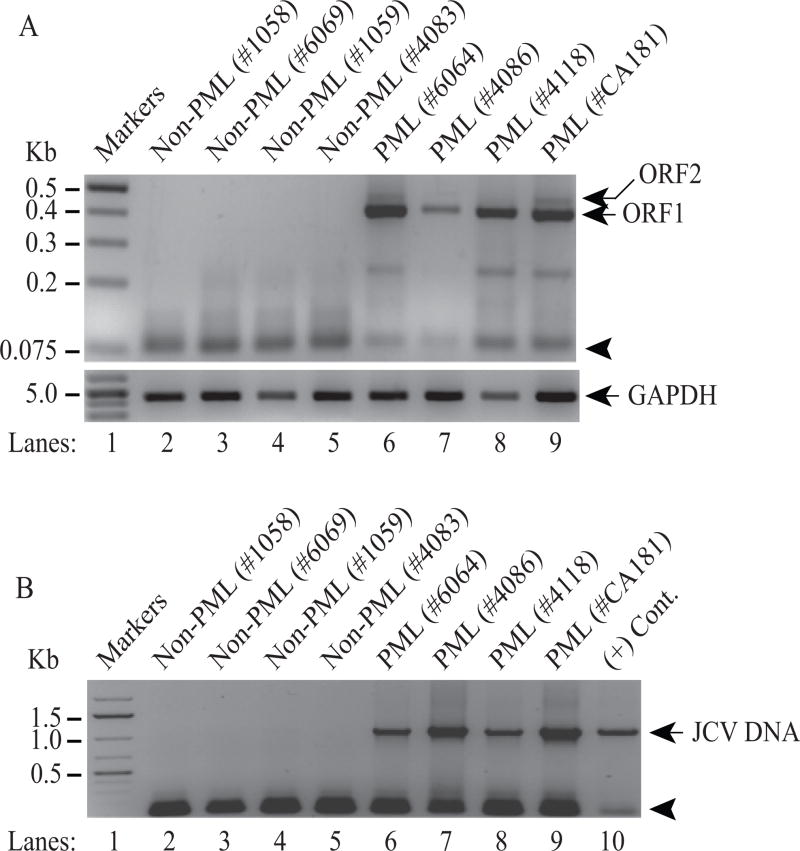
Figure 6. Detection of ORF1 and ORF2 transcripts in additional PML patients.
(A) Additional PML and Non-PML tissue samples were obtained from the National NeuroAIDS Tissue Consortium (NNTC) and total RNA isolated from these samples were subjected to RT-PCR amplification using the following primers: 5′-primer (1469-1489) and 3′-primer (780-755) as described in Materials and Methods. RT-PCR products were then analyzed by agarose gel (3%) electrophoresis. The position of the primers used in RT-PCR is indicated by an arrow head. Total RNA isolated from the PML and non-PML patients was also subject to RT-PCR amplification of the GAPDH cDNA as a control. (B) Detection of JCV DNA in PML brain tissue samples. In parallel to the RT-PCR assays in panel A, JCV DNA was also isolated from the PML and non-PML brain tissue samples and was PCR-amplified using 5′-primer (277-302) and 3′-primer (1366-1346) and analyzed by agarose gel (1%) electrophoresis as described in Materials and Methods. An arrow head points to the position of the primers used in the PCR reaction. In lane 10, JCV Mad-1 DNA was also PCR amplified as a positive control (+ Cont.).

