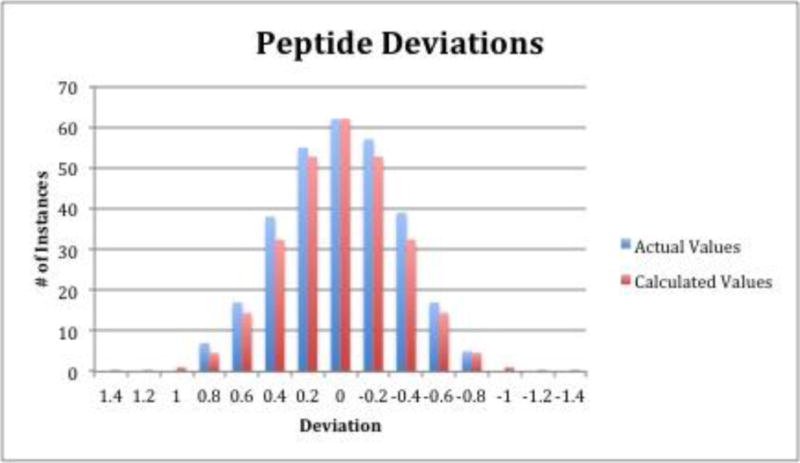
Figure 1.

Deviations of actual and theoretical retention times of the 297 peptides used in the study compared against a calculated Gaussian distribution of the data. Each deviation has a range of +/− 0.1 GU, so the value listed at 0 GU would include the range 0.1 to −0.1 GU.
