Figure 2.
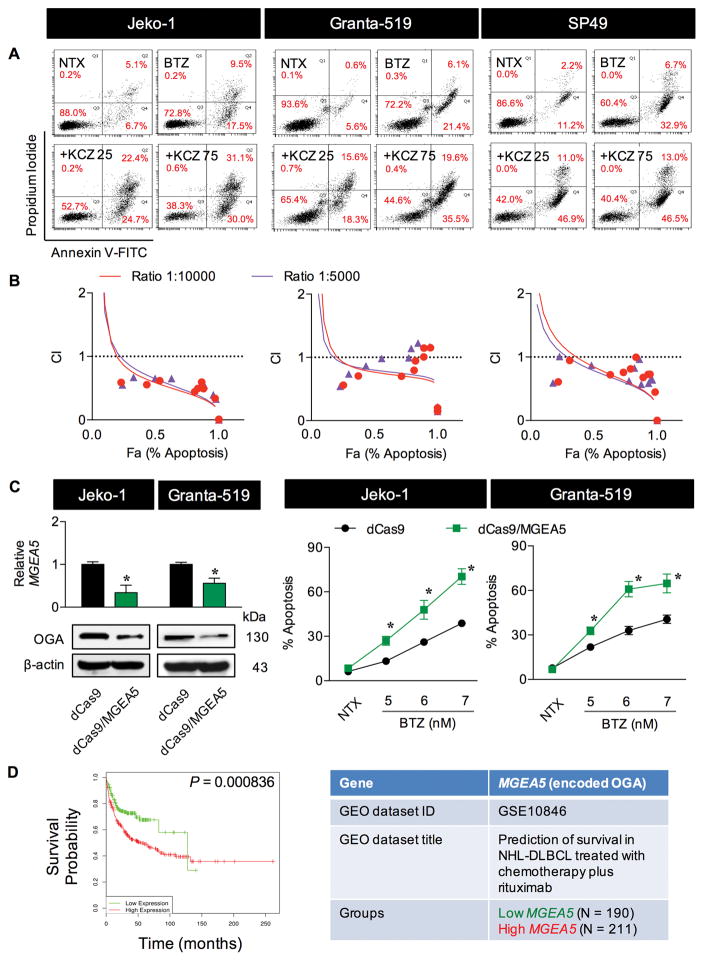
Drug-like OGA inhibitor KCZ sensitizes MCL cells to BTZ-induced apoptosis. (A) MCL cells were treated with BTZ (6 nM) in the presence of increasing concentrations of KCZ (0–75 μM) for 24 h and analyzed for apoptosis and necrosis by flow cytometry using annexin V and propidium iodide (PI) as probes. Representative dot plots of annexin V (x-axis) and PI (y-axis) are shown. Early and late apoptotic cells are in the lower and upper right quadrants with annexin V positive. NTX, non-treatment. (B) Combination index (CI) analysis by the fixed-ratio model. MCL cells were treated with BTZ and KCZ at the ratio of 1 to 10 and 1 to 5 and CI values were calculated and predicted (trendlines) using CompuSyn software. CI = 1, additivity; CI>1, antagonism; CI<1, synergy. (C) Transcriptional repression of MGEA5 (encoding OGA) was performed using CRISPR interference. (left) Quantitative real-time PCR of MGEA5 mRNA expression and Western blot analysis of OGA protein level in control (dCas9) and OGA-knockdown (dCas9/MGEA5) Jeko-1 and Granta-519 cells. (right) Effect of OGA inhibition on BTZ-induced apoptosis. Cells were treated with BTZ (0–7 nM) for 24 h and apoptosis was determined by Hoechst 33342 assay. Data are mean ± s.d. (n=3). *P < 0.05 vs. BTZ-treated dCas9 control cells; two-sided Student’s t-test. (D) Kaplan-Meier survival curve of patients with DLBCL, segregated according to high (red) or low (green) expression of MGEA5 (encoding OGA), obtained from public database through a bioinformatics analysis using PPISURV (www.bioprofiling.de).

