
Fig. 2. Evaluation of MTAG’s standard errors when there is sample overlap.
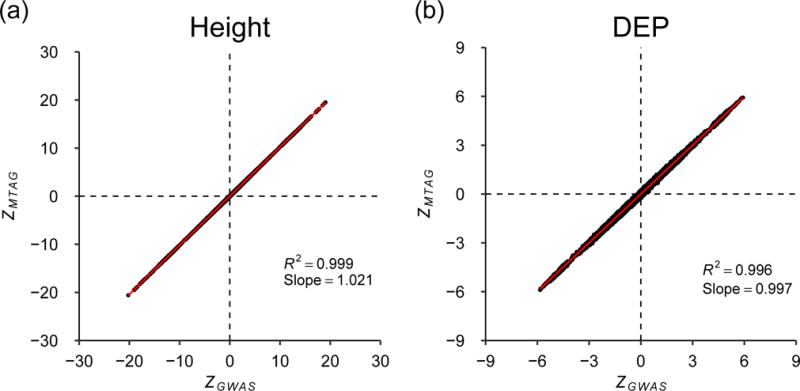
The x-axis is a SNP’s z-statistic from a baseline GWAS conducted in UK Biobank. The y-axis is a SNP’s z-statistic from applying MTAG to three GWASs of each trait conducted on equally sized subsamples of the baseline sample, in which every pair of samples has 50% overlap. (a) Height. (b) Depressive symptoms. The figure illustrates near-perfect alignment. See Supplementary Note for details and results from analogous analyses on additional phenotypes.