
Fig. 4. Manhattan plots of GWAS and MTAG results.
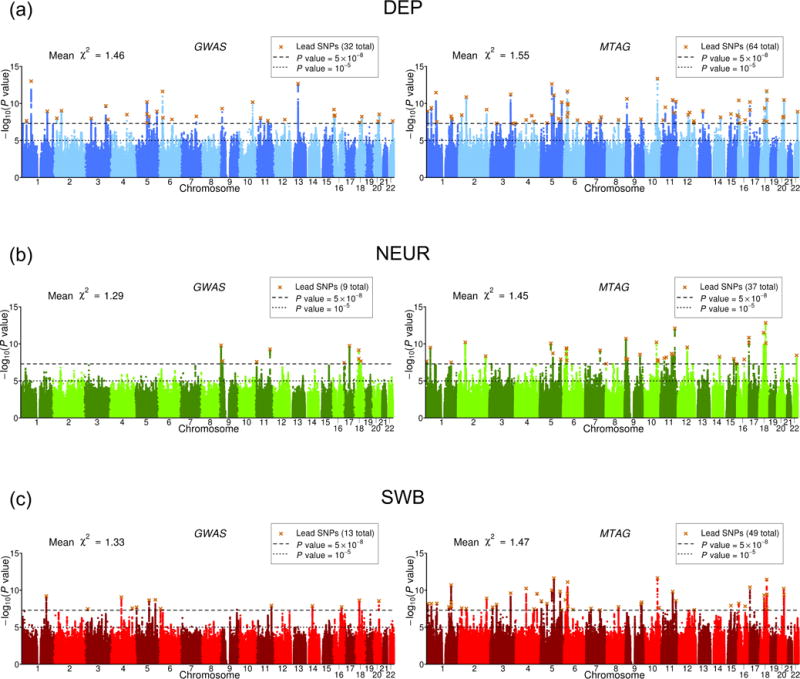
(a) DEP, (b) NEUR, (c) SWB. The left and right plots display the GWAS and MTAG results, respectively, for a fixed set of SNPs. The x-axis is chromosomal position, and the y-axis is the significance on a − scale. The upper dashed line marks the threshold for genome-wide significance ( ), and the lower line marks the threshold for nominal significance ( ). Each approximately independent genome-wide significant association (“lead SNP”) is marked by ×. The mean -statistic across all SNPs included in the analysis is displayed in the top left corner of each plot.