
Fig. 6. Predictive power of GWAS- and MTAG-based polygenic scores.
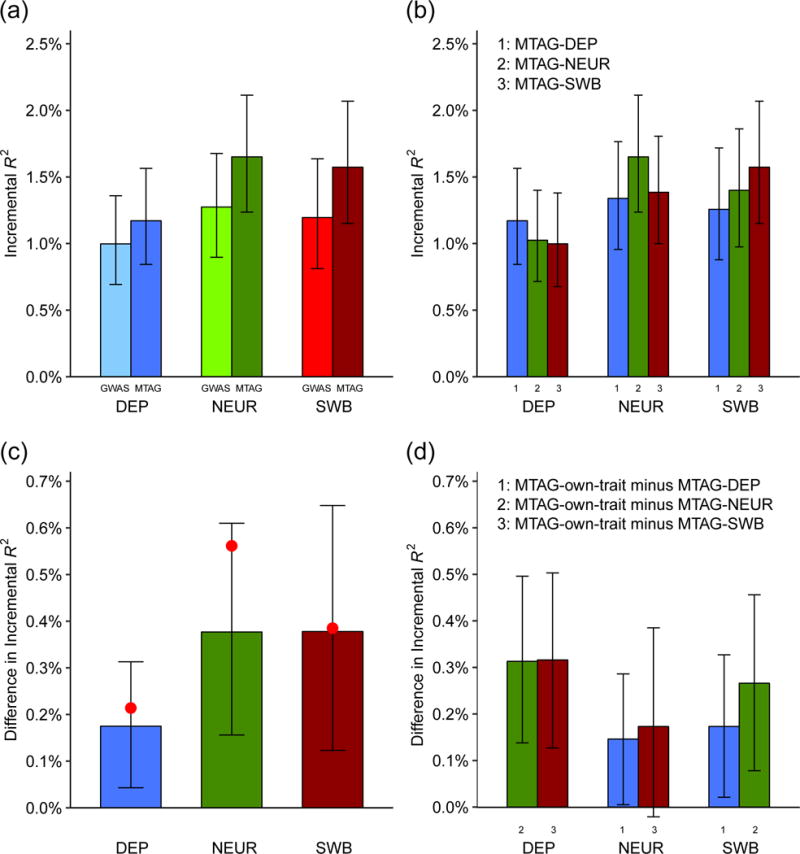
Incremental is the increase in from a linear regression of the trait on the polygenic score and covariates, relative to a linear regression of the trait on only covariates. The plotted incremental ’s (and differences in incremental ’s) are the sample-size-weighted means across the replication cohorts (HRS and Add Health, combined N = 12,641), with 95% intervals. See Supplementary Note for details and cohort-level results. (a) Incremental of MTAG-based and GWAS-based polygenic scores. (b) Incremental of polygenic scores constructed from the MTAG results for the predicted trait (“own-trait score”) or MTAG results for each of the other traits (“other-trait score”). The x-axis indicates the trait being predicted, and the bar color indicates which trait’s polygenic score is used. (c) Difference in incremental between the GWAS- and the MTAG-based PGS. Red dots indicate the theoretically predicted gains in prediction accuracy (Online Methods). (d) Difference in incremental between own-trait scores and the mean of the incremental ’s from the other-trait scores.