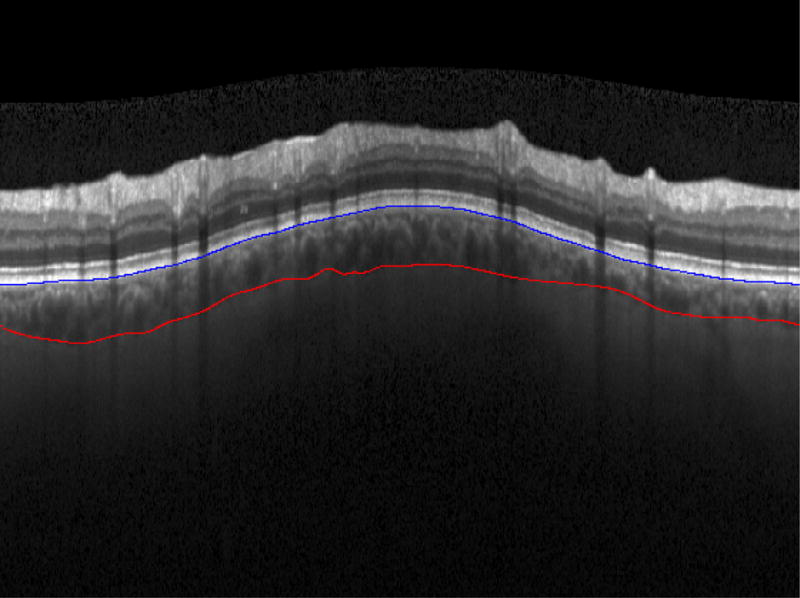
Figure 2.

Spectral-Domain Ocular Coherence Tomography (SD-OCT) image with San Diego Automated Segmentation Algorithm (SALSA) segmentation of the choroid, seen between Bruch’s membrane (blue line) and the Choroidal-Scleral Interace (red line)

Spectral-Domain Ocular Coherence Tomography (SD-OCT) image with San Diego Automated Segmentation Algorithm (SALSA) segmentation of the choroid, seen between Bruch’s membrane (blue line) and the Choroidal-Scleral Interace (red line)