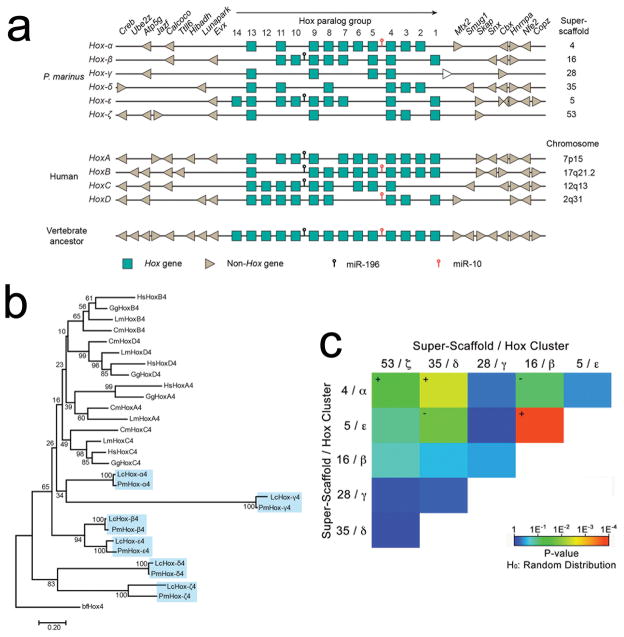
Figure 5. Structure and Evolution of HOX clusters.
a) Six Hox clusters can be identified within the sea lamprey genome assembly. Lamprey cluster designations α through ζ follow the convention of Mehta et al17. Hox genes are represented as boxes, with the direction of their transcription indicated by the black arrow. Flanking non-Hox genes are depicted as arrowheads, which indicate their direction of transcription. The positions of known micro-RNAs are indicated. The four human Hox loci and the inferred ancestral vertebrate Hox locus40 are shown for comparison. The white arrow downstream of the lamprey Hox-γ cluster represents PMZ_0048273, an uncharacterized non-Hox gene. b) The evolutionary history was inferred using the Neighbor-Joining method41. The optimal tree with the sum of branch length = 9.68 is shown. The percentage of replicate trees in which the associated taxa clustered together (bootstrap test with 100 replicates) are shown next to the branches. c) Tests for enrichment of 2-copy duplicates among all pairs of Hox-bearing chromosomes (super-scaffolds). Colors correspond to the degree to which the counts of shared duplicates on each pair of chromosomes deviates from the expected value given an identical number of chromosomes and paralogs retained on each chromosome (Probability estimates were generated using two-tailed χ2 tests and a total of n=200 independent pairs of duplicated genes: see Supplementary Table 6). Plus and minus symbols indicate the direction of deviation from expected for chromosome pairs with P<0.01.

