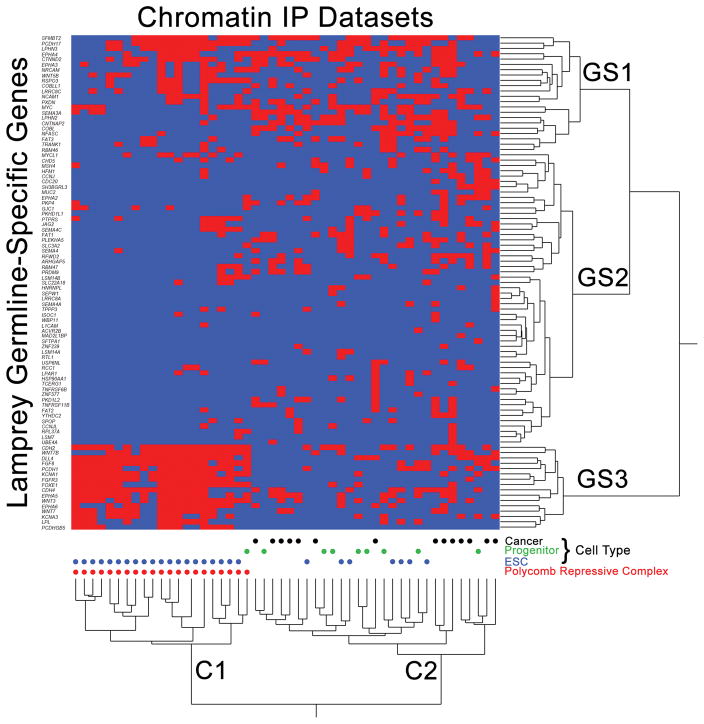
Figure 7. Enrichment analysis provides insight into the function of germline specific sequences.
Homologs of eliminated genes show strong overlap for the binding targets of polycomb repressive complexes in mouse embryonic stem cells (ESCs) and the binding sites of transcription factors in multipotent progenitor lineages and cancer cells (from ChEA 2016)32. Red cells denote ChIP experiments (x-axis) that identify peaks overlapping orthologs of lamprey genes (y-axis). ChIP enrichment statistics and ordering along the x-axis are provided in Supplementary Table 9. Labels GS1, GS2 and GS3 denote three primary clusters of germline-specific genes, C1 and C2 denote two primary clusters of ChIP experiments.

