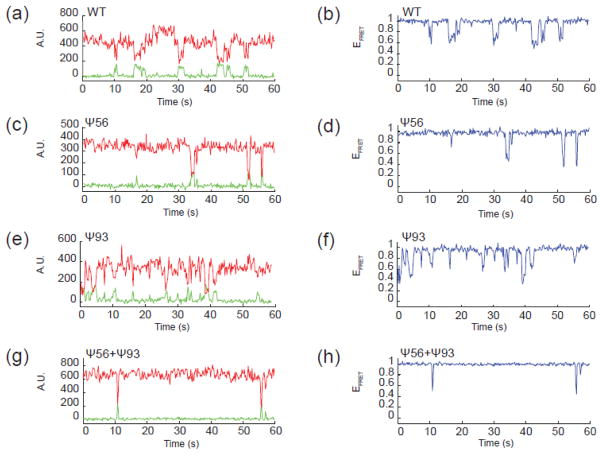
Figure 2.
Representative single molecule fluorescence data for U2 stem II model RNAs. (a, c, e, g) Fluorescence intensity data collected from a single RNA molecule by excitation of the Cy3 FRET donor and by simultaneously monitoring Cy3 (green) and Cy5 (red) fluorescence emission and reported in arbitrary fluorescence units (A.U.). Anti-correlated changes in Cy3 and Cy5 fluorescence intensity are observed for both the WT RNA (a) and each variant containing the indicated Ψ bases (c, e, g). (b, d, f, h) EFRET values calculated from raw fluorescence data shown in (a, c, e, g) for each RNA molecule.

