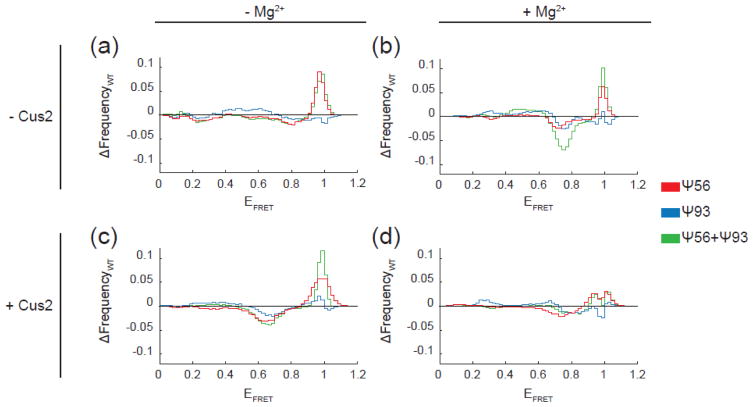
Figure 5.
The impact of pseudouridylation on stem II switching in comparison to the unmodified RNA. Each plot represents the result of subtraction of the histogram obtained from the WT RNA under the indicated condition from the histogram obtained using RNA containing one or more pseudouridines (see Fig. 3 and 4). Signals above zero indicate an increase in observances of those particular EFRET values due to pseudouridine incorporation, while signals below zero indicate a reduction in observances of those EFRET values.

