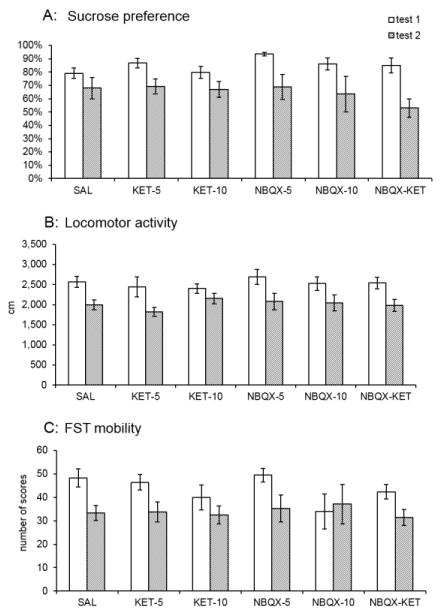
Figure 2.
Effects of various treatments on behaviour at baseline (i.e., before any alcohol exposure) and following alcohol exposure. The behavioural tests were carried out following alcohol withdrawal. Values are mean ± SEM, N=6–8/group. The significant decrease of overall sucrose consumption, locomotor activity and swimming (mobility) scores in the FST in test 2 are clearly visible but not marked in the graph.

