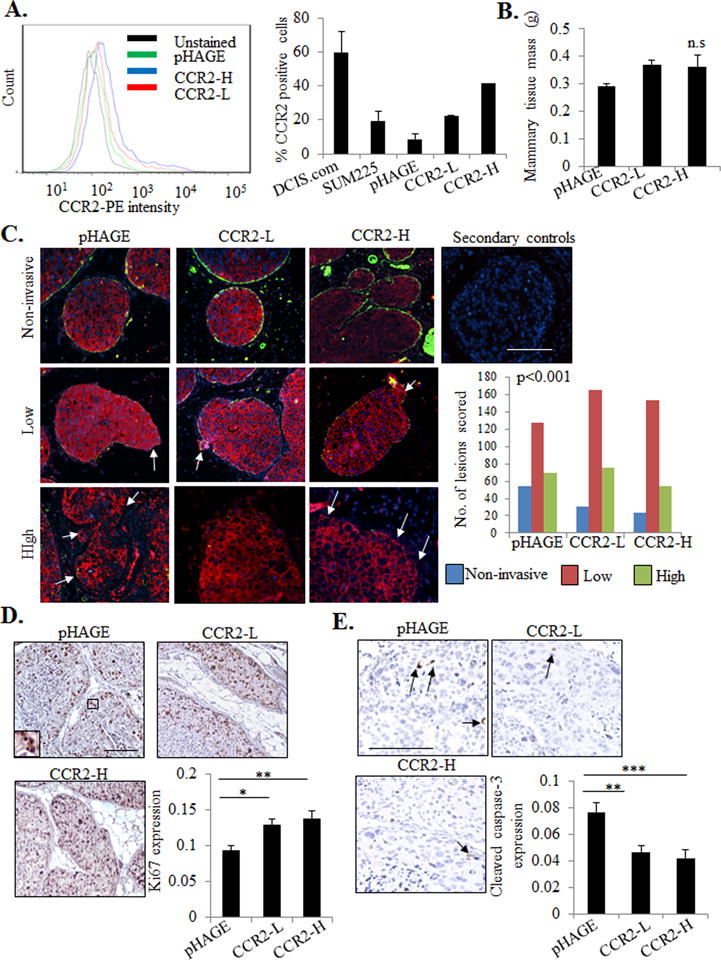
Figure 1. CCR2 overexpression in SUM225 breast cancer cells enhances invasive progression.

A. Flow cytometry analysis for CCR2 expression in parental DCIS.com or SUM225 parental cells or SUM225 cells expressing vehicle pHAGE control or CCR2 (CCR2-L, CCR2-H). Histogram analysis shown on left. Graph shows percentages of positive cells. B. Tissue mass of SUM225 MIND injected mammary glands C. SUM225 lesions were co-stained for CK-19 (red) and α-sma (green), and scored for the number of invasive lesions n=252 lesions for control pHAGE, 272 lesions for CCR2-L, and 231 for CCR2-H group. Representative images are shown with secondary antibody control panel of anti-rabbit-Alexa-fluor488/anti-mouse-Alexa-fluor-568/DAPI overlay. Arrows indicate invasive foci. D-E. Image J quantification of immunostaining for Ki67 (D) or cleaved caspase-3 (E) in SUM225 lesions (arbitrary units). Arrows point to examples of positive staining. Statistical analysis was performed using One way ANOVA with Bonferonni post-hoc comparison (B, D, E) or Chi square test (C). Statistical significance was determined by p<0.05. *p<0.05. ns= not significant. Mean±SEM values are shown. Scale bar=200 microns.
