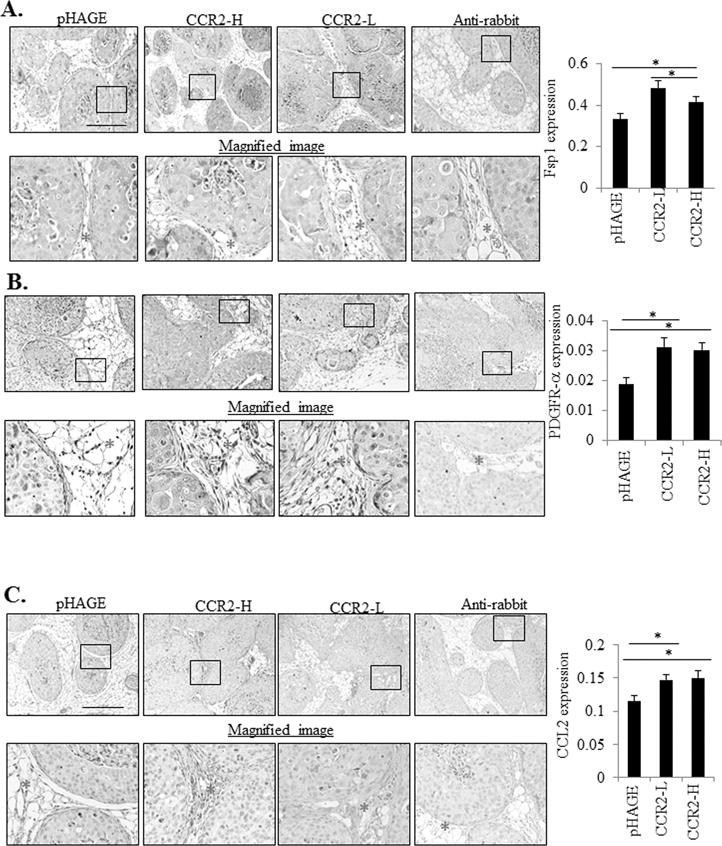
Figure 3. CCR2 overexpression in SUM225 MIND xenografts increases the levels of CCL2 expressing fibroblasts.

Sum 225 MIND lesions were immunostained for A. Fibroblast Specific Protein 1 (Fsp1), B. Progesterone Growth Factor Receptor-α (PDGFR-α). or C. CCL2 expression. Representative images are shown with magnified image underneath. The stroma is marked with an asterisk in the magnified image. Expression in the stroma was quantified by Image J, in arbitrary units. Statistical analysis was performed using One way ANOVA with Bonferonni post-hoc comparison. Statistical significance was determined by p<0.05. *p<0.05, ***p<0.001. Mean±SEM values are shown. Scale bar=400 microns.
