
Figure 2.
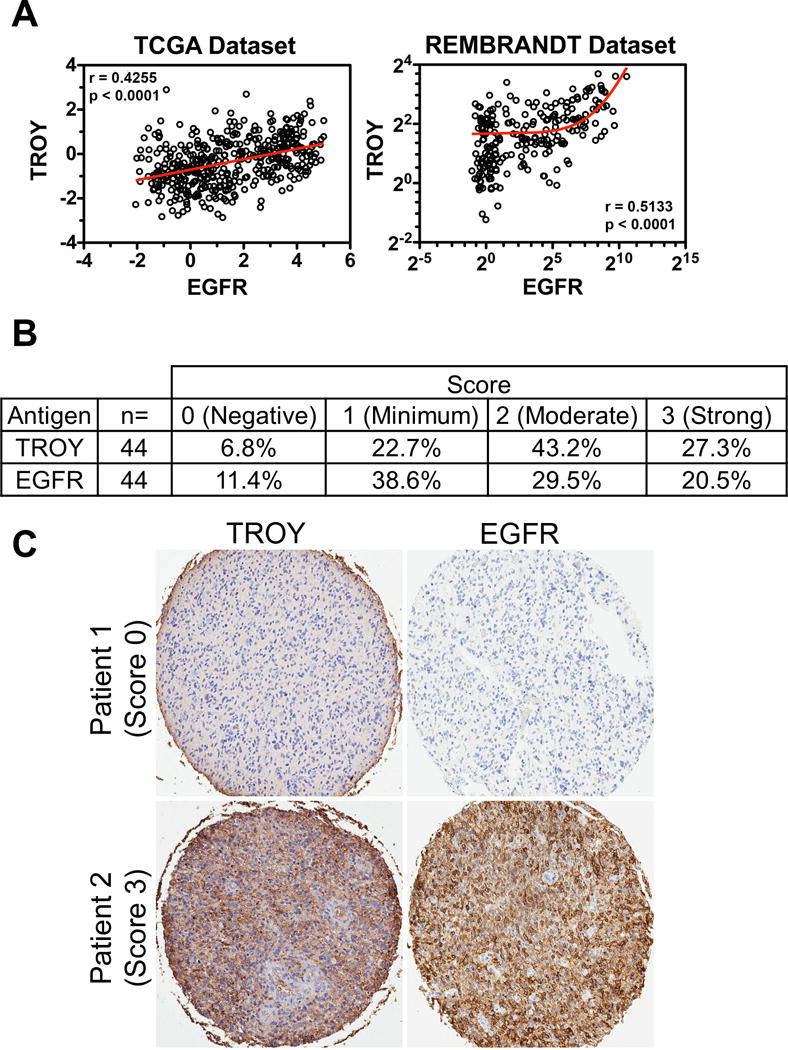
TROY expression positively correlates with EGFR in GBM. (A) TROY mRNA expression in GBM correlates with EGFR mRNA expression determined by Spearman’s correlation. The mRNA expression level of TROY and EGFR was examined in the RNA seq database from TCGA (data depicted as relative Z-score value) and the REMBRANDT GBM microarray dataset (data depicted as log2 ratio). (B) A total of 44 samples on a tissue microarray were scored for TROY and EGFR expression and the percentage distribution of staining intensity of TROY and EGFR was assessed. (C) TROY and EGFR staining on representative samples from two patients with GBM (X5 objective, Aperio GL Scanner). The correlation between the two stains was analyzed using Kendall’s tau correlation test (Kendall Tau = 0.63; p < 0.0001).