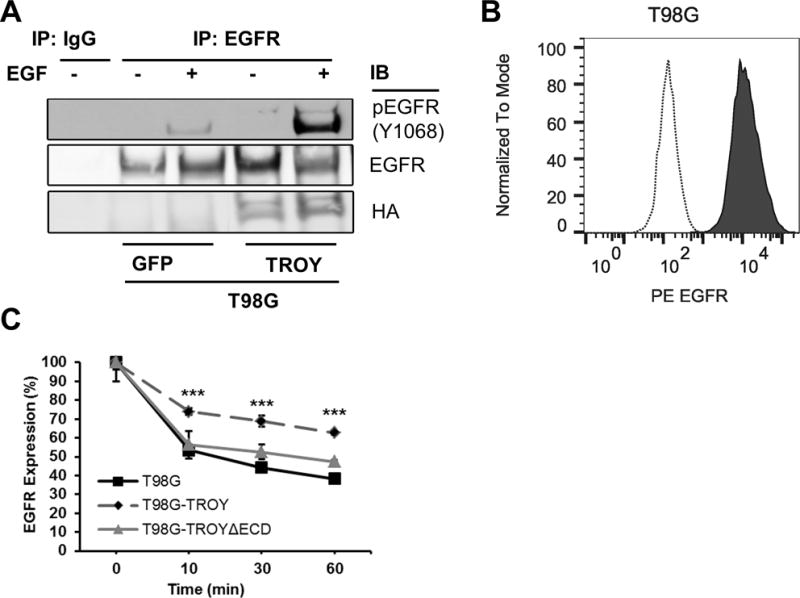
Figure 6.

Enhanced EGFR phosphorylation and delayed EGFR internalization in TROY overexpressing cells. (A) T98G cells overexpressing GFP (control cells) or T98G cells overexpressing TROY were serum starved, left untreated or stimulated with 20 nM EGF for 10 mins. The plasma membrane proteins were extracted and immunoprecipitated with anti-EGFR antibody, and the precipitates were immunoblotted with the indicated antibodies. (B) EGFR surface expression was analyzed by flow cytometry. Depicted are histograms of EGFR surface expression on fixed T98G cells with a PE-labeled anti-EGFR antibody (solid line) or an isotype control antibody (dotted line). (C) Surface EGFR expression. Serum starved T98G cells or T98G cells overexpressing TROY or T98G cells overexpressing TROYΔECD were incubated with 20 nM EGF at 37 °C. At 10, 30 and 60 minutes after EGF addition, surface expression of EGFR was analyzed using mouse anti-EGFR PE conjugated antibody by flow cytometry. Data is normalized to surface expression of untreated cells. ***, p < 0.001.
