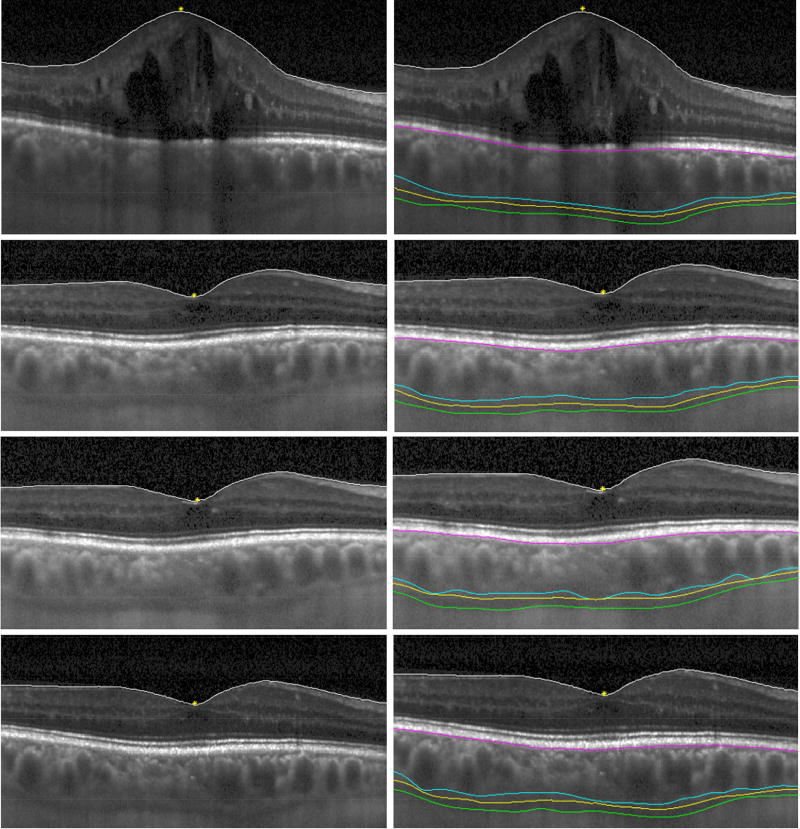
Figure 1.
Semi-automated choroidal segmentation of EDI-OCT images before and after suprachoroidal triamcinolone acetonide and intravitreal aflibercept injection in an eye with ME due to RVO.
Images are shown before injection (top row), and at 1 month (second row), 2 months (third row), and 3 months (bottom row) after treatment, with (left column) and without (right column) segmentation boundaries, including the inner limiting membrane (white line), RPE/Bruch’s membrane complex (purple line), vascular choroidal thickness boundary (blue line), stromal choroidal thickness boundary (yellow line), and total choroidal thickness boundary (green line). The fovea is labeled with a yellow asterisk.

