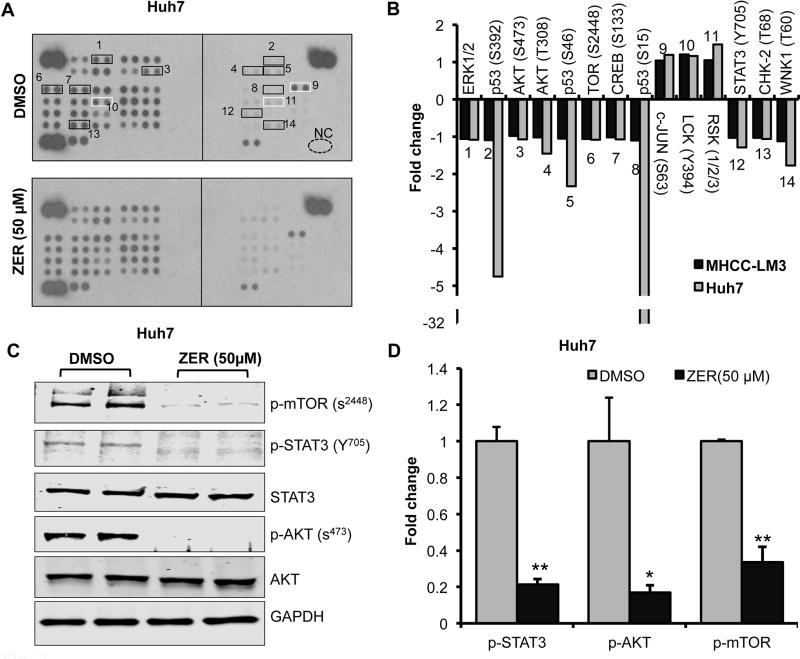
Fig. 3. ZER alters phosphoprotein profiles including that of AKT/mTOR and STAT3 in HCC cells.
(A) Phosphokinase profiling in Huh7 cells treated with ZER. Lysates (250µg protein) from cells treated with ZER (50 µM) or DMSO for 24 hours were analyzed for relative levels of phosphorylation of 43 protein phosphorylation sites using antibody array kits. Black and white boxes mark the hypo- and hyper- phosphorylated proteins, respectively. (B) Quantitative analysis of altered phosphorylation in ZER treated Huh7 and MHCC-LM3 cells. Quantitation was done using Image J. (C) Immunoblotting of several kinases in Huh7 cells treated with ZER (50 µM) for 24 hours. (D) Quantitative analysis of phosphoproteins altered in Huh7 cells treated with ZER. *p<0.05 and **p<0.01, two tailed t-test

