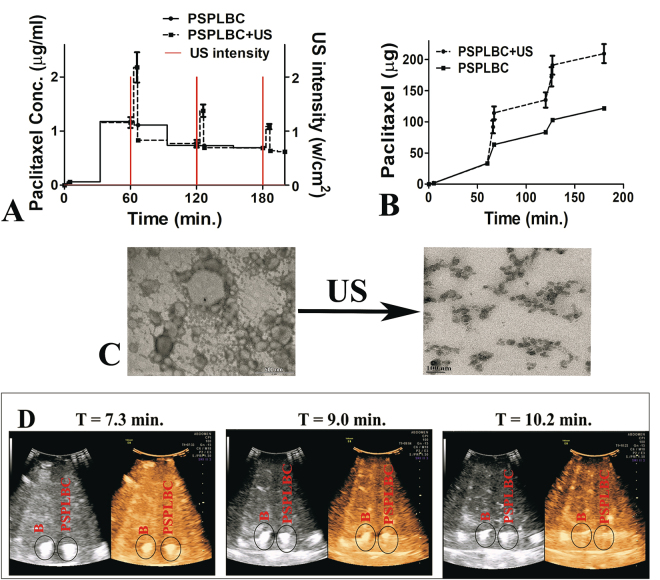
Figure 2.
In vitro triggered release study. (A) Shows the US-trigger intensity profile and the concentration of released paclitaxel in sink solution; (B) Shows the cumulative release plot, for both with US-trigger. (C) Shows the TEM images of PSPLBC before and after US-trigger. The observed lipid fragments confirmed the complete destruction of intact PSPLBC into lipid fragments upon US exposure. (D) Ultrasonography of B and PSPLBC in both B-mode (grey) and contrast mode (Solaris) using 5–7 MHz probe.

