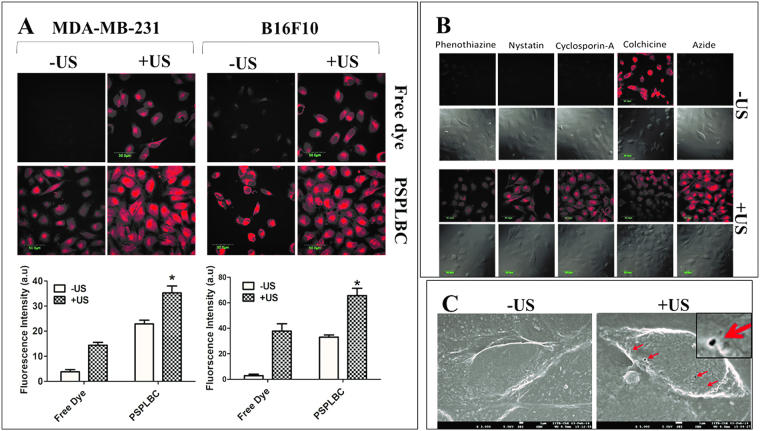
Figure 3.
Cellular internalization study. (A) CLSM images of MDA-MB-231 and B16F10 cells treated with free rhodamine-6G dye, free dye+US, rhodamine-6G loaded PSPLBC, and rhodamine-6G loaded PSPLBC+US. The fluorescence intensity was quantified from three random CLSM images. (*p ≤ 0.05). (B) Mechanism of PSPLBC cellular internalization studied using cells pre-treated with various metabolic & endocytic inhibitors. CLSM images show the uptake of PSPLBC by pretreated cells, both with and without application of trigger. (C) Cryo-FEG-SEM images of the cell without US-treatment and immediately after PSPLBC+US treatment. The red arrows show the sonopores on the cell surface, the inset shows the zoom-in picture of a sonopore, (scale bar = 1 µm).

