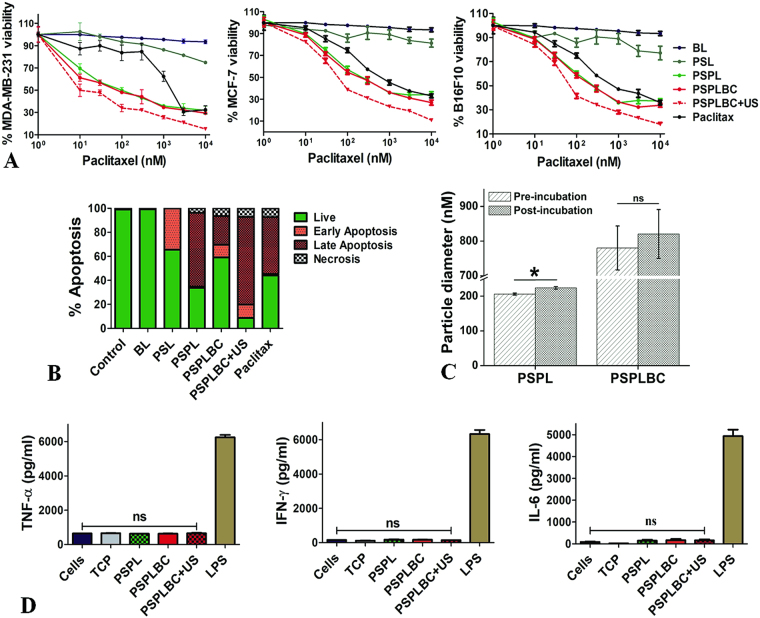
Figure 4.
In vitro studies. (A) Shows the drug dose-response plots for MDA-MB-231, MCF-7, and B16F10 cells. (B) Shows stacked histogram for the percentage of the cellular population in different apoptotic phases after treatment with the respective formulation. (C) Hydrodynamic diameter of the PSPL and PSPLBC, pre- and post-incubation with FBS for 02 hours. (D) Shows the levels of secreted TNF-α, IFN-γ and IL-6 cytokines by the PSPLBC treated RAW cells (*p ≤ 0.05, ns = not significant).

