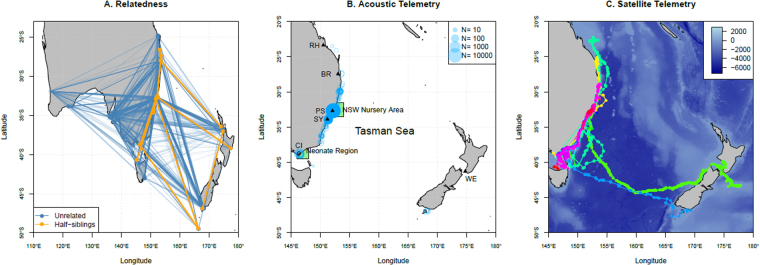
Figure 1.
Data collection. (A) Relatedness: Pairwise comparisons between juvenile white sharks (JWS) collected at specific locations shown linked by lines. Blue lines indicate comparisons where sharks were unrelated; orange lines identify half-siblings (HSPs). HSPs were geographically restricted to eastern Australia and New Zealand supporting the two population model for Australasia. HSPs were mixed throughout the range of the sample population indicating a lack of bias in the opportunistic sampling strategy. (B) Acoustic Telemetry: Distribution of acoustic detections of tagged JWS. Green boxes indicate the location of nursey areas where sharks were tagged. (C) Satellite Telemetry: Satellite tracks of tagged JWS tagged in NSW and Vic nursery areas. Both satellite tracking and acoustic telemetry data are consistent with the known distribution of white sharks in eastern Australia. RH = Rockhampton, BR = Brisbane, PS = Port Stephens, SY = Sydney, CI = Corner Inlet, WE = Wellington. All map figures were generated using the R39 packages ggplot240, ggmap41, and gridExtra42 found on the Comprehensive R Archive Network (https://cran.r-project.org/).

