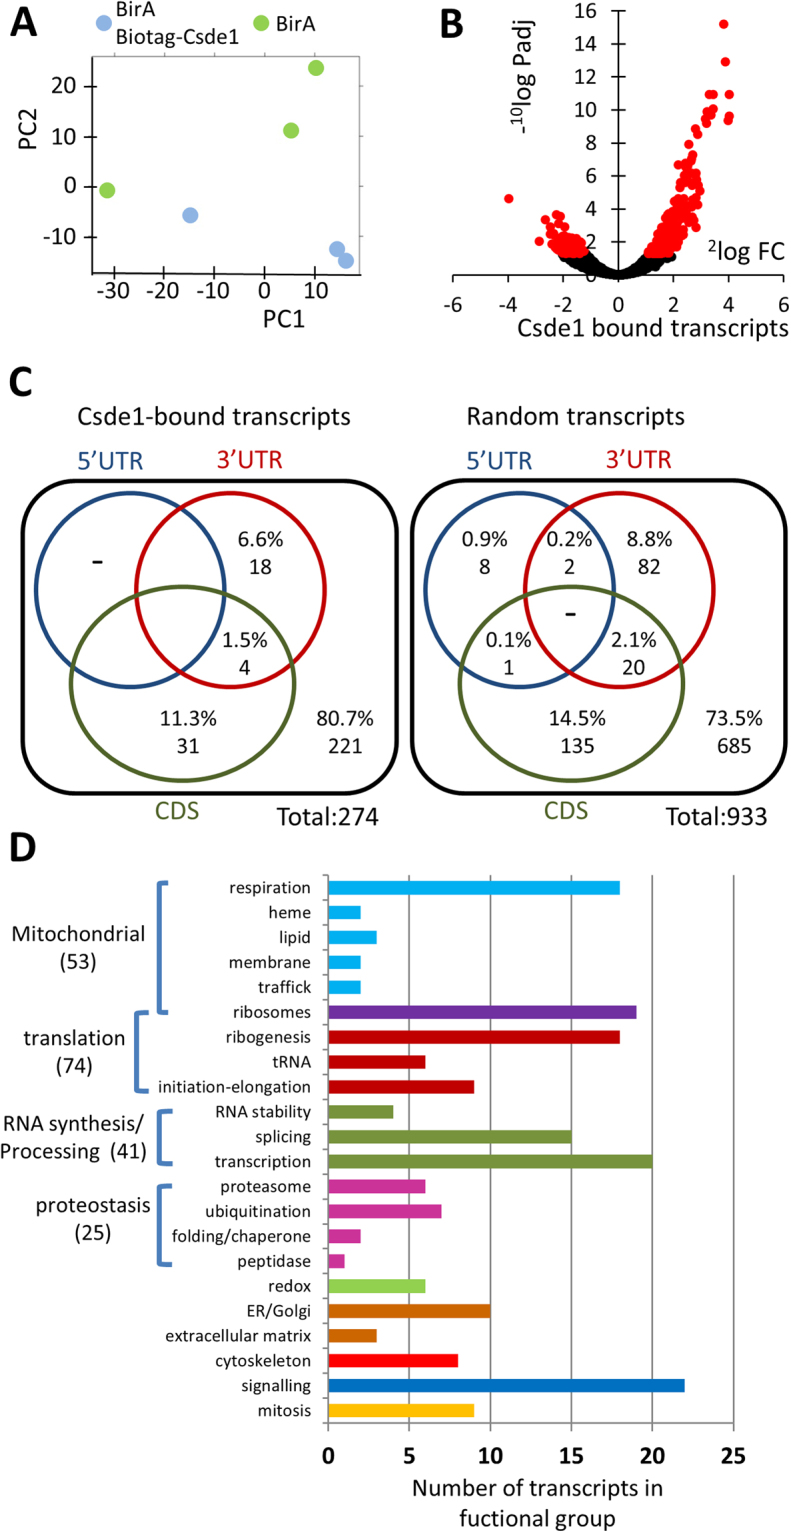
Figure 2.

Identification of Csde1-bound transcripts. RNA was isolated from independent streptavidin bead eluates derived from MEL cells expressing BirA alone (N = 3), or BirA plus biotag-Csde1 (N = 3). RNA was sequenced, and differential abundance was analyzed by Deseq2. (A) Principle component analysis (green: BirA; blue BirA plus biotag-Csde1). (B) 10log(P-adjusted) plotted against 2log(fold change) of differentially enriched transcripts. Red: FDR < 0.05 (C) At FDR < 0.05 we identified transcripts from 274 unique genes (pseudogenes excluded) that associated with Csde1. Potential Csde1 binding sites ([A/G]5AAGUA[A/G], or [A/G]7AAC[A/G]2) are indicated (percentage and total number) for the 5′UTR (blue), protein coding region (CDS; red) and 3′UTR (green); for the 274 Csde1-bound transcripts, and for almost 1000 control transcripts. (D) Each transcript was assigned a unique label that best represented its function. The number of transcripts within a specific function are depicted (overarching functions in the same color).
