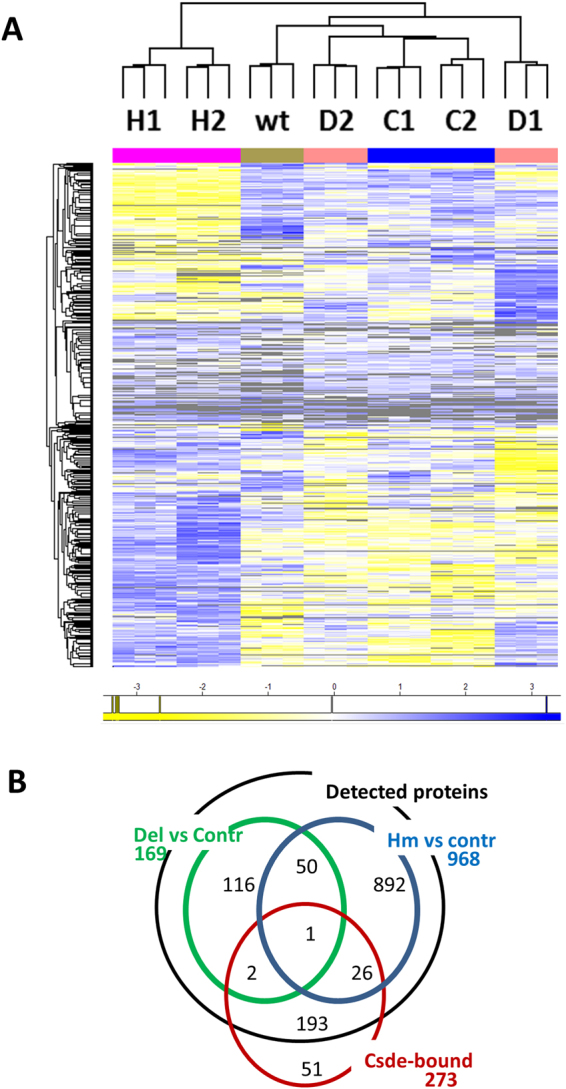
Figure 4.

Proteome of Csde1 deletion mutants. Total MEL cell lysates of 2 Hm clones (H1, H2), 2 Del clones (D1, D2), 2 clones with a heterozygous out-of-frame deletion (C1, C2), and the parental MEL cells (wt) were analysed by mass spectrometry. Three lysates were analysed for each clone. Data were analysed by MaxQuant and Perseus (A) Proteins differentially regulated between Hm and control clones (C1, C2 and wt), or between Del and control clones were subjected to Pearson clustering. (blue: upregulated, yellow: downregulated, grey: not detected). Proteins and their Z-score in the order of this heatmap are listed in Supplementary Table S-V. (B) The overlap between genes encoding proteins differentially expressed between Del and control clones (169, green circle); between Hm and control genes (968, blue circle) and genes encoding Csde1-bound transcripts of which proteins were detected by mass spectrometry (222, red circle) (FDR < 0.05).
