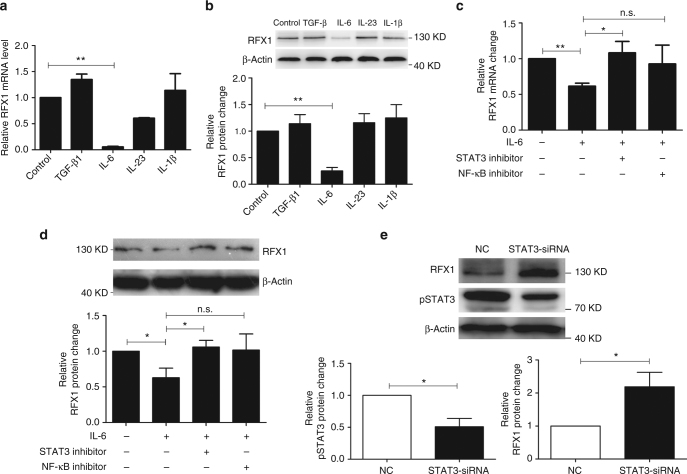
Fig. 8.
The IL-6-STAT3 pathway inhibits RFX1 expression. a, b qPCR and western blot analysis of RFX1 mRNA and protein expression levels in CD4+ T cells upon TGF-β, IL-6, IL-23, or IL-1β stimulation. c, d qPCR and western blot analysis of RFX1 mRNA and protein expression levels in CD4+ T cells stimulated by IL-6 along with STAT3 inhibitor or NF-κB inhibitor. The y axis indicates the fold-change in RFX1 expression compared with a negative control. e Western blot analysis of RFX1 and phosphorylated STAT3 (pSTAT3) in CD4+ T cells transfected with STAT3 siRNA or negative control (NC) at 48 h after transfection. Negative control was set as “1”. The y axis indicates the fold-change in RFX1 expression compared with a negative control. The protein expression level is calculated by the ratio of protein to β-actin. Data are representative of three independent experiments (mean ± s.d.; n = 3). *P < 0.05, **P < 0.01, compared between the indicated groups. n.s., not significant. P-values were determined using two-tailed Student’s t-tests

