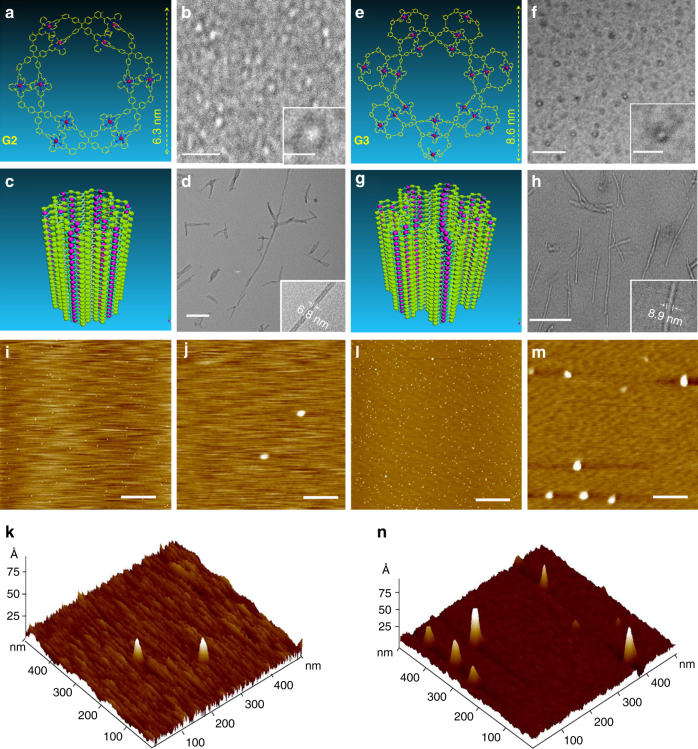
Fig. 4.
TEM and AFM images of G2 and G3. Representative energy-minimized structure from molecular modeling of a G2 and e G3 (alkyl chains are omitted for clarity); TEM images of single molecular b G2 (scale bar, 30 nm and 10 nm for zoom-in image) and f G3 (scale bar, 100 nm and 30 nm for zoom-in image); proposed stacking structure of c G2 and g G3; TEM images of nanotubes assembled by d G2 (scale bar, 200 nm) and h G3 (scale bar, 200 nm) 0.5 mg mL−1 in acetonitrile solution under isopropyl ether vapor; AFM images of i, j G2 (scale bar, 2 μm and 100 nm, respectively) and l, m G3 (scale bar, 2 μm and 100 nm, respectively); 3D AFM images of k G2 and n G3

