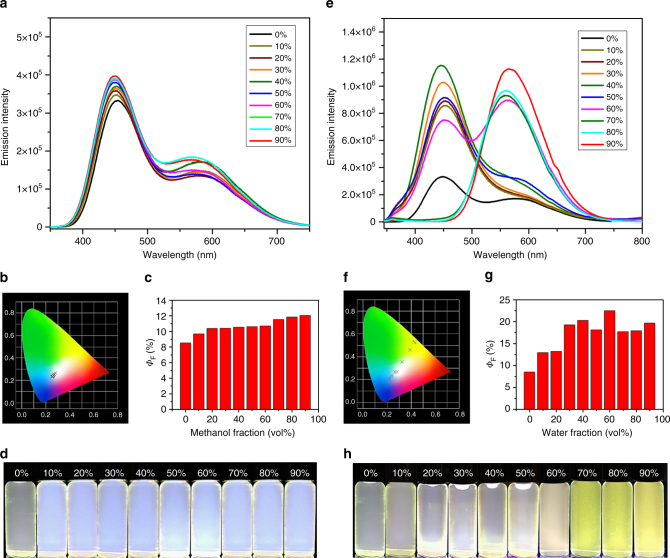
Fig. 5.
AIE of G2. a Fluorescence spectra (λex = 320 nm, c = 1.0 µM), b CIE 1931 chromaticity diagram, (the crosses signify the luminescent color coordinates), c quantum yields, and d photographs of G2 in CH3CN/methanol with various methanol fractions; e fluorescence spectra (λex = 320 nm, c = 1.0 µM), f CIE 1931 chromaticity diagram, g quantum yields, and h photographs of G2 in CH3CN/water with various water fractions. G2 samples were excitation at 365 nm on 298 K (c = 1.0 μM)

