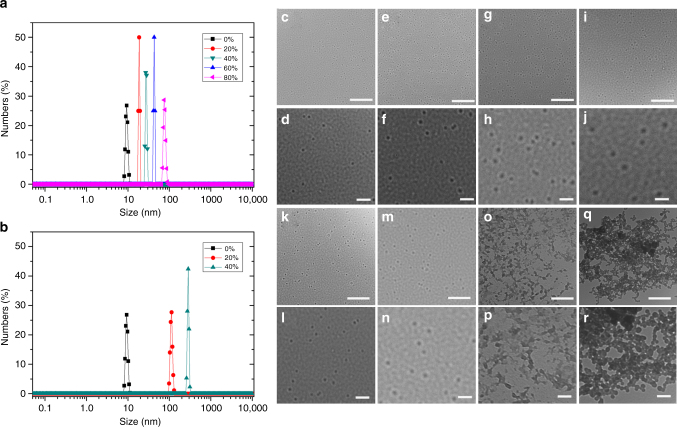
Fig. 7.
DLS data and TEM images of G2 aggregates. Size distribution of G2 in a acetonitrile/methanol, and b acetonitrile/water mixtures by DLS (the percentages in the graphs are the poor solvent contents); TEM images of the aggregates of G2 formed in acetonitrile/methanol mixtures containing c, d 20%, e, f 40%, g, h 60%, and i, j 80% methanol (scale bar 500 nm for the upper images and 100 nm for the lower images, respectively), and aggregates of G2 formed in acetonitrile/water mixtures containing k, l 20% (scale bar, 2 μm and 500 nm, respectively), m, n 40% (scale bar, 2 μm and 500 nm, respectively), o, p 60% (scale bar, 1 μm and 500 nm, respectively), and q, r 80% water (scale bar, 1 μm and 500 nm, respectively)

