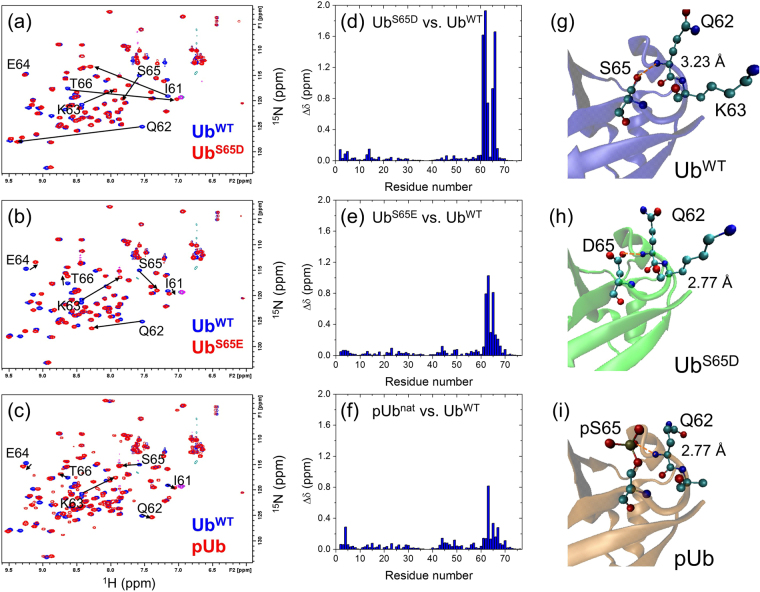
Figure 2.
NMR and structural comparison of pUb and phosphomimic Ub variants with UbWT. (a–c) Overlay of 1H-15N correlation spectra of (a) UbS65D, (b) UbS65E, and (c) pUb (all colored red) with the spectrum of UbWT (blue). Signals belonging to several residues around the modification site are indicated, their shifts are marked with arrows. (d and e) Spectral differences seen in panels (a–c) quantified as amide chemical shift perturbations in (d) UbS65D, (e) UbS65E, and (f) pUb versus UbWT as a function of residue number. (g–i) Comparison of the crystal structures of (g) UbWT (PDB ID: 1UBQ), (h) UbS65D (this work), and (i) pUbnat (PDB ID: 4WZP); zoom on the area containing residue 65. The numbers indicate the distance (shown by the orange dashed line) between the backbone amide nitrogen of Q62 and the closest to it oxygen of the side chain of S65, D65, or pS65, respectively.

