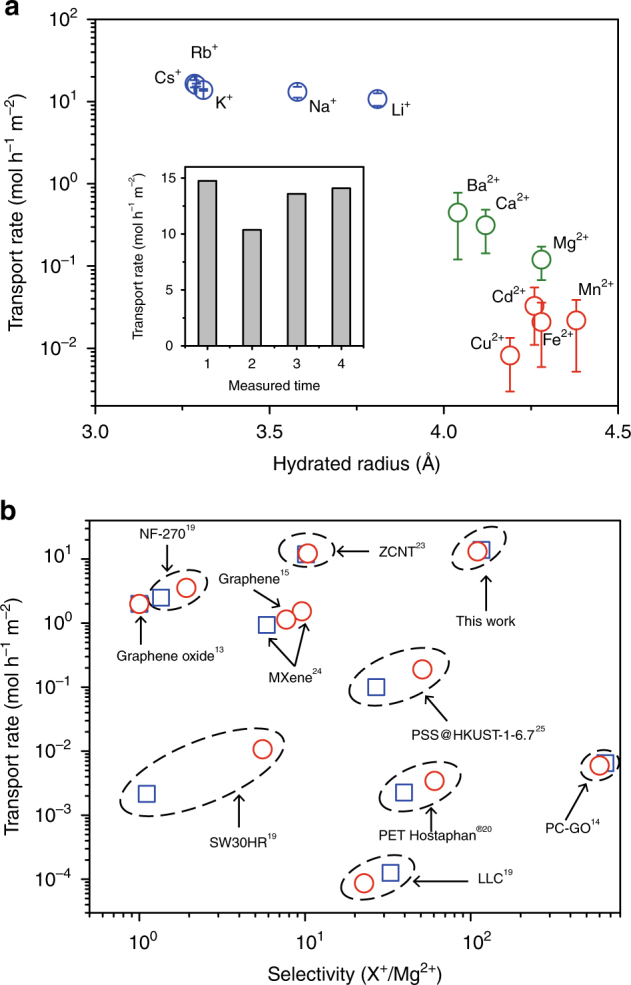
Fig. 1.

Transport rates and selectivity. a Transport rates of alkali metal ions (blue), alkaline earth metal ions (green), and transition metal and heavy metal ions (red) measured with ICP, as a function of the hydration radius of the ions. The transport rates are normalized to a 1 M feed solution and measured under 10 V applied voltage. Error bars represent the standard deviation of at least three independent measurements using different membrane samples. The inset shows the transport rates of Na+ ions of four independent measurements. Unless otherwise specified, the membranes were 2-µm-thick PET Lumirror® membranes irradiated with 1.4-GeV Bi ions at a fluence of 5 × 10¹⁰ ions cm−2 and subsequently exposed to UV radiation for 4 h. b Transport rates vs. selectivity of various nanoporous membranes; the ionic sieving membrane studied in this study outperforms in both transport rates and ionic selectivity of K+/Mg2+ (blue) and Na+/Mg2+ (red)
