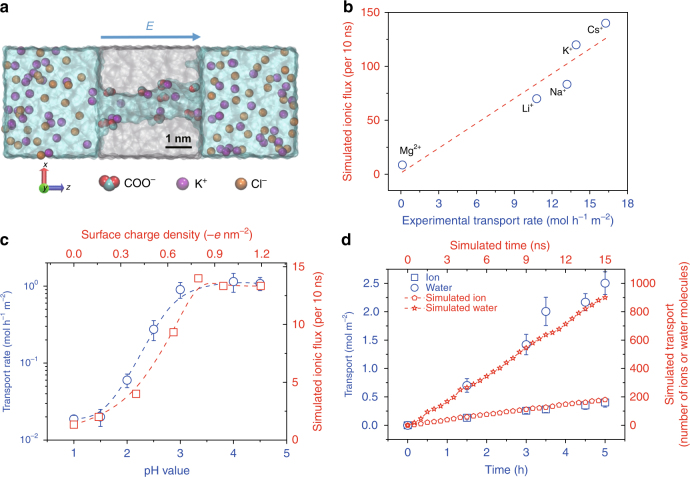
Fig. 2.
MD simulations and transport measurements. a Cross-sectional scheme of polymeric nanopore model with 1 M KCl electrolyte solution on both membrane sides. The polymer matrix material is shown in gray; negatively charged residues (COO−) are shown in red (O) and cyan (C); K+ and Cl− ions are shown in purple and yellow, respectively. For all simulations without specification, a voltage of 1.2 V is applied along the pore axis, i.e., z direction. b Simulated vs. experimental transport rates for various ions. The red dashed line is a linear fit to the data (blue circles) (R2 = 0.88). c Experimental (circles) and simulated (squares) transport rates of K+ ions as a function of pH (blue) and surface charge density (red), respectively. Error bars represent the standard deviation of three measurements. The average transport rate of K+ ions through the PET Lumirror® films was measured with a feed solution of KCl (1 M) and an applied voltage of 5 V. A voltage of 0.12 V is applied across the pore in the simulation. The blue and red dashed lines are fits to the experimental and simulation data, respectively. d Comparison of simulated and experimental transport number of ions or water molecules. Water and ion transport through the PET Lumirror® film from the feed chamber with a 0.01 M KCl solution and an applied voltage of 10 V in the experiment. Dashed lines are linear fits

