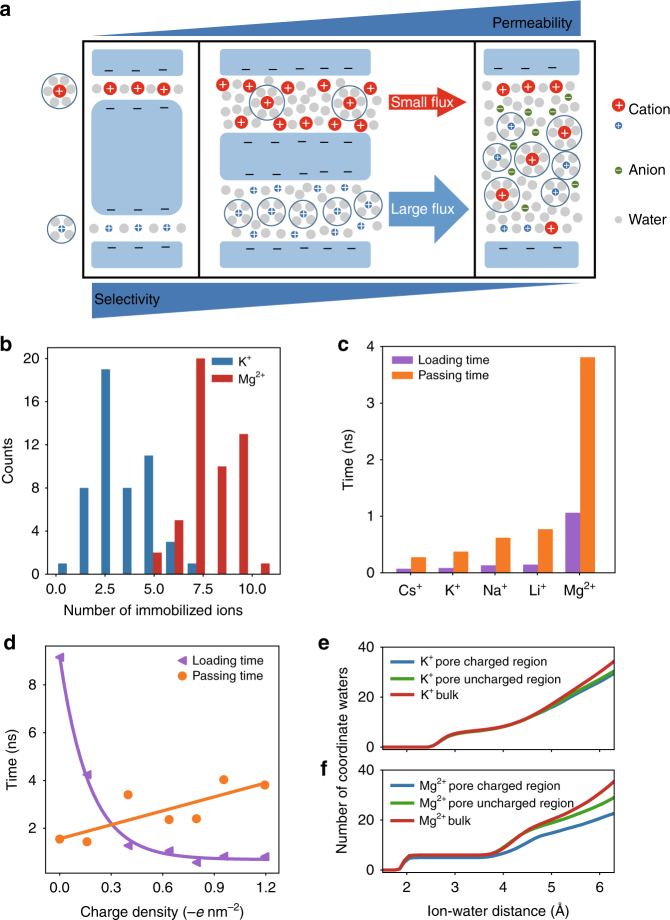
Fig. 3.
Simulated ionic transport phenomena. a Schematic of three representative ionic transport mechanisms as the pore size increases in nanopores with negatively charged sidewalls (blue). When the pore size is less than the hydration radius of the cations, the dehydration energy determines the ionic selectivity. The nanopore shows great selectivity but low permeability (left panel). As the pore size is much larger than the Debye screening length, the nanopore shows great permeability but no ionic selectivity (right panel). When the pore size is between the two cases, the nanopore shows high transport rate of one cation and high selectivity between the two cations if their interaction with the pore surface is different (middle panel). This represents the scenario of the transport mechanism of the nanoporous Lumirror® films. b Histogram of immobilized K+ (blue) and Mg2+ (red) ions on the inner surface of the nanometer pore. c Average loading time (purple) and passing time (orange) for Cs+, K+, Na+, Li+, and Mg2+ ions. d Average loading time (purple) and passing time (orange) of K + ions as a function of surface charge density of the nanopores. Dashed lines are the respective linear and exponential fits of the passing and loading times. e, f Cumulative radial distribution function of water molecules surrounding K+ ions (e) and Mg2+ (f) in the bulk solution (red), inside the nanopore close to the uncharged region (green) without negative inner surface charges or charged region (blue) with negative inner surface charges and trapped ions

