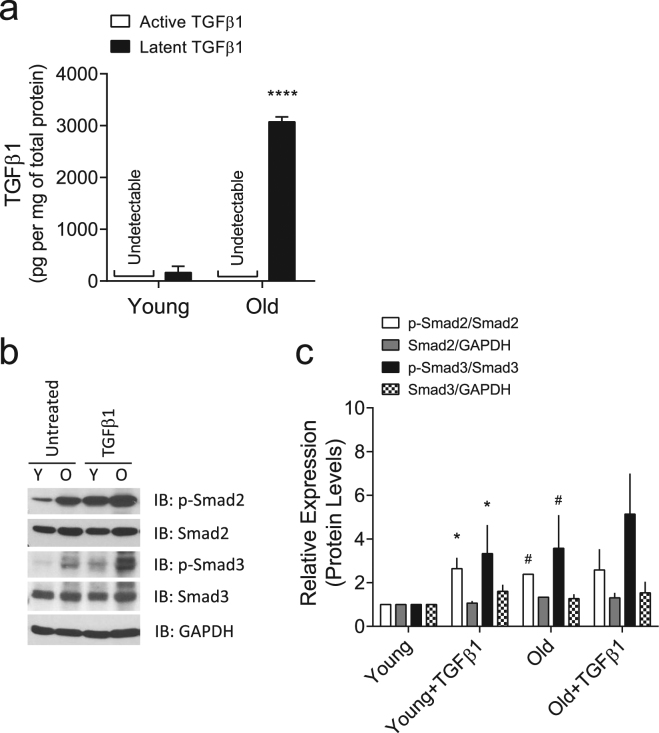
Figure 2.
TGFβ1 expression and signaling in VSM cells. (a) Production of TGFβ1 by young vs. old VSM cells as detected by sandwich enzyme-linked immunosorbent assay. Data are presented as Mean ± SD (n = 3). (b,c) VSM cells (young and old) were treated for 24 h with or without 5 ng/ml TGFβ1. (b) Phosphorylation levels of Smad2/3 were detected by western blot (Full gel/blot is shown in the Supplementary Figure 5). (c) Quantitation of the protein levels. Data are expressed as Mean ± SD (n = 3). *P < 0.05 (untreated vs. TGFβ1 treated); #P < 0.05 (young vs. old).

