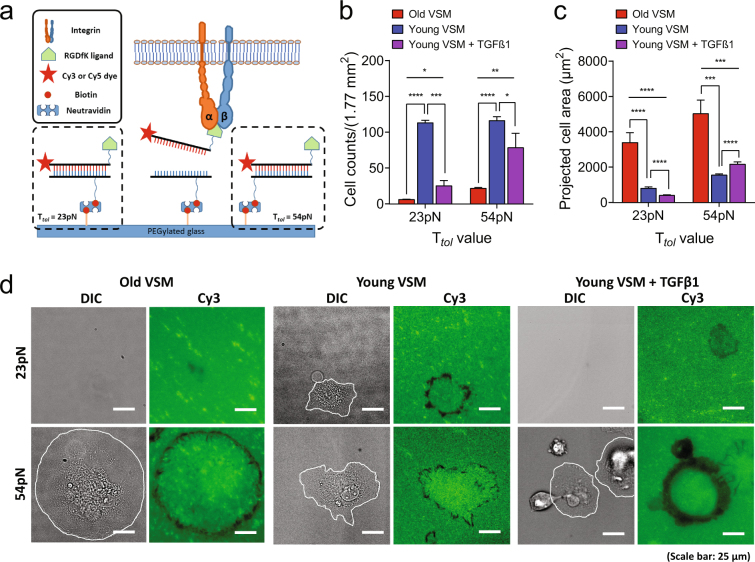
Figure 5.
Cell adhesion and spreading on TGT surfaces (incubation time, t = 2 h). (a) A schematic of TGT assay. (b) Total number of adherent VSM cells on 23 and 54 pN TGT surfaces. The number of adherent cells after 2 h incubation was counted. The TGT assay in each condition was repeated at least three times. Data are presented as Mean ± SE (n = 3 or 4). (c) Measured projected area of each adherent cell on 23 and 54 pN TGT surfaces. Data are presented as Mean ± SE. On 23 pN TGT surface: n = 19, old VSM; n = 37, young VSM; n = 61, young VSM with TGFβ1. On 54 pN TGT surface: n = 25, old VSM; n = 171, young VSM; n = 348, young VSM with TGFβ1. (d) TGT rupture patterns marked by an individual VSM cell. Cell boundary is drawn in white line. dsDNA tethers rupture (fluorescence signal loss in the Cy3 channel) when a stronger molecular tension above a tension tolerance (Ttol) is applied on a receptor-ligand bond. Scale bar is 25 µm. *P < 0.05; **P < 0.01; ***P < 0.001; ****P < 0.0001.

