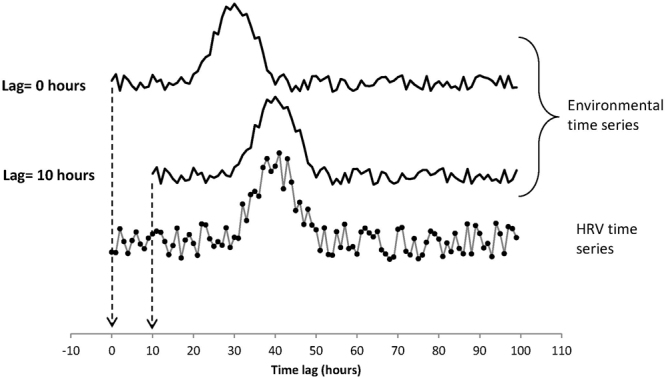
Figure 2.

Two data series representing an environmental time series and a HRV time series. The environmental signals position at lag 0 (upper series) is as it occurred relative to the HRV signal. The middle trace shows the same environmental data series after shifting it in time by 10 hours. In this example, correlations between the HRV and environmental data would be higher at lag 10 than at lag 0 indicating a delayed physiological response to the external environmental signal.
